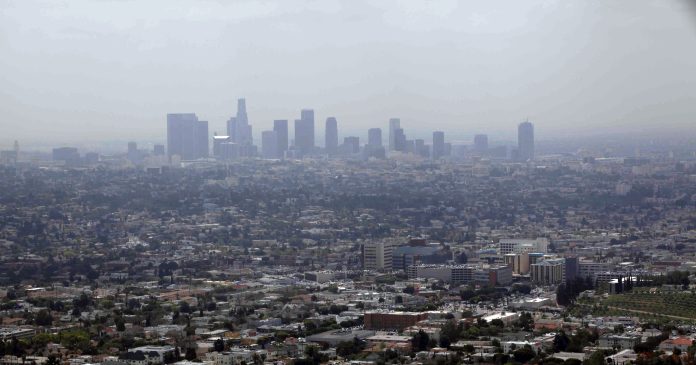
WASHINGTON (May 23, 2023) — The U.S. Environmental Protection Agency (EPA) released its annual interactive report tracking America’s progress in controlling air pollution. “Our Nation’s Air: Trends Through 2022†offers readers an opportunity to learn about the health and environmental impacts of air pollution; track trends in air quality and emissions data, explore efforts to improve visibility in treasured national parks; and explore community-level health impacts of air toxics emissions reported for 2020.
“This report highlights the crucial role EPA’s work – coupled with the unrelenting efforts of our state, tribal, community and industry partners – have played in improving air quality across the country,â€Â said EPA Administrator Michael S. Regan. “Even as the economy grows, we continue to see dramatic long-term reductions in air emissions. This progress is encouraging, and we will continue to collaborate with our partners to protect public health and ensure clean air for all.â€
EPA examines long-term trends to track the nation’s progress toward clean air. The report released today shows that, between 1970 and 2022, the combined emissions of six key pollutants dropped by 78%, while the U.S. economy remained strong — growing 304% over the same time.
In addition, national average concentrations of harmful air pollutants decreased considerably across our nation between 1990 and 2022:
- Carbon Monoxide (CO) 8-Hour,81%
- Lead (Pb) 3-Month Average,88%Â (from 2010)
- Nitrogen Dioxide (NO2) Annual,60%
- Nitrogen Dioxide (NO2) 1-Hour,54%
- Ozone (O3) 8-Hour,22%
- Particulate Matter 10 microns (PM10) 24-Hour,34%
- Particulate Matter 2.5 microns (PM2.5) Annual,42%Â (from 2000)
- Particulate Matter 2.5 microns (PM2.5) 24-Hour,42%Â (from 2000)
- Sulfur Dioxide (SO2) 1-Hour,90%
It is important to note that air quality concentrations can vary year to year, even as human-caused emissions continue to decline. In 2022, national average concentrations of lead and nitrogen dioxide increased slightly over 2021 levels. Variations in weather, and events such as dust storms and wildfires can have an impact on air quality in affected areas. Many environmental impacts associated with climate change can impact air quality particularly affecting the severity and timing of the wildfire season, including changes in temperature, precipitation, and drought.
The report spotlights the projects selected as part of EPA’s Enhanced Air Quality Monitoring Competitive Grants, providing information for each project as of November 2022 when selections were announced. These funds will enhance air quality monitoring in communities across the United States – particularly those that are underserved, historically marginalized, and overburdened by pollution.
The report includes interactive graphics that enable citizens, policymakers and stakeholders to view and download detailed information by pollutant, geographic location and year.


