


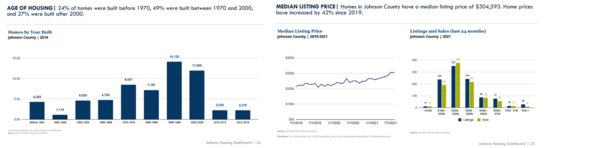
If you haven’t had a chance to look at the Indiana Housing Dashboard mentioned in last week’s note, take a few moments to click around. In the meantime, here are a few tips as to how the site can help you learn about Housing in Indiana. The first thing that pops up when visiting is a brief user guide which includes a video that highlights the many functions of the site. Continuing to the Dashboard’s front page, you will notice the four main data points (Population, Housing, Housing Availability & Jobs) at the upper left. In addition to viewing these statistics for the entire state, you may review them for each of our 92 counties, or even compare counties to each other or to the state as a whole. Did you know that Hillenbrand, Inc. is the largest employer in Franklin County, or that the median salary in LaPorte County has increased nearly 14% over the past 10 years? A quick use of the comparison tool reveals that 69.1% of residences in Indiana are owner occupied, while those numbers are 77% and 61.8% in Lawrence and Vigo Counties respectively. You can also use the Export Full Report tab to produce a 32-page in-depth report. In the screen shot below, you’ll see a screenshot of Johnson County, which showed that 27% of all homes were built after 2000, and that home prices have increased an average of 42% since 2019 with a median listing price of $304,593. Since 2010, the median rent there has increased by 22% with a median rent at $955 as of 2019. All the data and statistics contained within will be continuously updated as new census and other data sources are utilized. All of the above and much more is available online 24/7 for individuals, housing providers, stakeholders and municipalities. |
 |


