
|
|
|
|
EAST PEORIA, Ill. -Â University of Southern Indiana Volleyball punches its ticket to the GLVC Tournament Championship game after sweeping the two-seeded, No. 7 UMSL Tritons. The Screaming Eagles earned their first birth to a GLVCÂ Championship match since 2008 while seeking its first tournament championship since 2004.
Enroute to its 16th win of the season, USI formed a fortress on defense, collecting 18 blocks and 56 digs. The Eagles defense, which ranks among the best in the GLVC, held the opposing Tritions to an attack percentage of .085, forcing 22 attack errors. USI’s theme in the conference tournament has been defense, holding the opposing forces to a .128 attack percentage, amassing 36 blocks, and 94 digs. The net defense has been led by junior middle blocker Sidney Hegg with 2.33 blocks per set while libero Callie Gubera leads the dig-effort with 3.67 digs per set.  The Screaming Eagle offense has not slowed down in the conference tournament with four Eagles averaging two-plus kills per set and six players recording an ace so far. Leah Anderson has set the pace for the attack with 4.00 kills per set and five aces in the GLVC tournament.
The Eagles’ offense bombarded the opposing Triton defense with six players recording at least three kills. The kill-effort was led by Anderson with 11, followed by Taylor Litteken with 10 kill on a .600 hitting percentage. The All-Conference sophomore Anderson also led the match in service aces with four while USI nabbed seven total compared to UMSL’s zero. Litteken also added two digs, one assist, and one block with 10.5 points in the match.
The USI offense also featured All-Conference sophomore Katherine Koch blasting seven kills and dishing out a career-high in assists with 15. Koch was second on the team in assists with Casey Cepicky recording 19 assists. Freshman Abby Weber collected six kills and an ace, being followed by Hegg and Abby Bednar, who each posted three kills.
The defensive effort of USI involved the entire team with seven players thwarting an opposing attack and eight players laying out for multiple digs in the three-set sweep. Hegg led the USI defense at the net with a career-mark in blocks (9), adding two digs and 8.5 total points. Leading the Eagles in digs was the senior Gubera with 13 followed by Koch with 11. Cepicky and Weber each scooped up nine while Anderson added seven more digs.
NOTES:
USI will look to collect its first tournament championship since 2004, a team which went featured USI Volleyball Head Coach Randi Raff, when they beat SIU Edwardsville 3-1 (25-30, 30-24, 30-20, 30-25 | 11/13/04). The 2004 USI Volleyball team went 24-7 overall and 15-1 in the GLVC.
The Screaming Eagles out-performed the seventh-ranked Tritons in all major statistical categories, with a major difference in attack percentage (.190 to .085), points (57.0 to 39.0) aces (7 to 0) and blocks (18 to 10).
USI won its sixth-straight contest with three matches won via a sweep, including UIndy, Lindenwood, and UMSL. This was USI’s ninth win via a sweep on the year.
Sidney Hegg marked a career-high in blocks with nine against the Tritons to lead the USI net defense. In the GLVC Tournament, Hegg has averaged 2.33 blocks per set.
Leah Anderson marked a sixth-straight match with double-digit kills and points with 11 kills and 16.5 points against UMSL. The outside hitter is averaging 4.00 kills per set, 0.83 aces per set, and 5.25 points per set.
SPRINGFIELD, Ill.—Â University of Southern Indiana Men’s Tennis (7-5, 2-2 GLVC) was defeated 5-2 in their Great Lakes Valley Conference match this morning by University of Illinois Springfield (8-3, 2-2 GLVC), 5-2 at Chatham Glenwood High School.
DOUBLES:Â The Screaming Eagles were swept in all matches by the Prairie Stars, dropping the doubles point. Senior Kooper Falkenstein and sophomore Preston Cameron did make it interesting losing in the No. 3 doubles before falling, 7-6.
SINGLES: Senior Spencer Blandford had a heck of a No.6 singles victory prevailing in a tiebreaker set, 11-9. Blandford picked up his second win on the year.
Sophomore Lucas Sakamaki collected his 12th victory of the season in the No. 5 in straight-sets. Sakamaki upped his record to 12-2 on the season.
Up Next:Â The Eagles will host University of Indianapolis on April 23 in Evansville, Indiana for another GLVC showdown.
University of Southern Indiana Softball hit a combined five doubles and six home runs as it rolled past Southwest Baptist University for a Great Lakes Valley Conference doubleheader sweep Saturday afternoon at the USI Softball Field.
The Screaming Eagles (9-15, 7-10 GLVC), who have won five straight games, had a pair of doubles and two home runs in a 6-0 win in the opener. They racked up three doubles and four home runs in a 19-0, five-inning victory in the nightcap.
Senior outfielder Alicia Webb (Elberfeld, Indiana) went a combined 4-of-6 with a double, two home runs and eight RBI to lead the Eagles, who finished the day with a combined 24 hits.
Game 1: USI 6, SBU 0
Junior catcher Courtney Schoolcraft (Crest Hill, Illinois) went 2-for-3 with a double and a home run, while sophomore pitcher Allie Goodin(Evansville, Indiana) tossed seven scoreless innings as USI cruised to the 6-0 win in the opener.
Goodin got the scoring started in the home half of the second inning as her double to left-center field sent sophomore catcher/designated player Sammie Kihega (Greenfield, Indiana) home. Kihega got hung up at third base and eventually found herself in an old-fashioned pickle before out-running SBU third baseman Emma Ezzell to home plate for the first score of the contest.
Schoolcraft followed later in the frame with an RBI-double to give the Eagles their second run and a 2-0 advantage.
USI tacked on three more tallies to their total in the fifth inning as Schoolcraft hit a lead-off home run to put USI up 3-0. Sophomore shortstop Jordan Rager (Fishers, Indiana) and Webb had back-to-back sacrifice flies later in the frame to put USI up 5-0.
Freshman first baseman Lexi Fair (Greenwood, Indiana) had a solo shot in the sixth inning to finish the Eagles’ game-one scoring.
Goodin (5-5) earned the win in the circle after scattering six hits and six strikeouts throughout seven innings of work.
Game 2: USI 19, SBU 0 (5 inn.)
USI scored nine runs in the second, four in the third and six more in the fourth to earn a 19-0 win over the Bearcats (2-30, 1-17 GLVC) in the nightcap.
The Eagles sent 13 batters to the plate and racked up seven hits in their nine-run second inning, including a two-run triple by junior third baseman Mary Bean (Schaumburg, Illinois), a two-run home run by Webb and a three-run home run by Goodin. Junior pitcher Katie Back (Indianapolis, Indiana) started the action with a run-scoring single, while Rager also had an RBI-single.
Six of the nine runs scored in the second inning came with two outs on the scoreboard.
In the third, Webb hit her first-career grand slam to give USI a 13-0 advantage, while her RBI-double in the fourth inning put USI up 17-0.
USI sent 12 more batters to the plate in the fourth inning as USI had six more hits, including an RBI-double by junior pitcher Maddie Duncan(Lynnville, Illinois). Bean put USI up 15-0 with a sacrifice fly, while freshman centerfielder Mackenzie Bedrick (Brownsburg, Indiana) gave the Eagles a 16-0 advantage.
Kihega capped off USI’s scoring with a two-run blast over the centerfield fence.
Back (4-7) got the win in the circle for USI after allowing just one hit in three innings of work. Duncan finished the game, allowing two hits in two innings to complete the shutout.
Up Next
USI returns to action Sunday at noon when it hosts Drury University in a GLVC doubleheader at the USI Softball Field. The Panthers (20-9, 14-4 GLVC) split a GLVC-doubleheader at McKendree University Saturday after splitting a conference twinbill with Maryville University Thursday.
Aces drop both contests against Bulldogs
 DES MOINES, Iowa – Alyssa Barela launched two home runs in Saturday’s doubleheader against Drake, which saw the Bulldogs edge the Purple Aces in a pair of games at Buel Field.
Evansville (18-15, 6-8 MVC) fell by a 2-0 final in the opener before Drake (10-25, 4-10 MVC) finished the day with an 8-4 victory.
 Game 1
The opener was a pitcher’s duel with Izzy Vetter and Nicole Timmons each tossing gems. The Bulldogs scored an unearned run in the first as Libby Ryan reached on an error to lead the game off, going all the way to third before coming home on a Macy Johnson single. UE had a hit by Jessica Fehr in the first and Eryn Gould in the sixth, but could not get a run home.
Drake added another run in the bottom half of the sixth on a solo home run by Addie Lightner to double the lead and would win by the 2-0 final. Timmons picked up the win, allowing two hits and striking out nine. Vetter gave up just four hits and fanned six batters.
Game 2
Game two saw Drake get off to a fast start, plating five runs before an out was recorded in the bottom of the first. Highlighting the frame was a 3-run homer from Makayla Rice. Jenna Lis doubled to lead off the second while Eryn Gould hit a 2-out double in the third, but the shutout continued for the Bulldogs.
Alyssa Barela made sure to changed that as her first home run of the season led off the fourth inning to make it a 5-1 game. The long ball proved to be contagious as Jessica Fehr led off the fifth frame with a solo shot before Marah Wood added another with one out to cut the DU lead to two. After the Bulldogs got one of those runs back in the bottom of the fifth, Barela went yard for the second time, hitting her second home run of the game in the sixth to get UE within a pair once again.
Unfortunately, the Bulldogs were able to tag two more runs on the board in the bottom of the frame on a Libby Ryan homer and hung on for the 8-4 win. Jaime Nurrernbern made the start, giving up five runs while Erin Kleffman threw six innings of relief. She had a strong outing, allowing three runs on seven hits while throwing 103 pitches. Mackenzie Hupke picked up the win for Drake, allowing three runs on five hits over 4 1/3 innings. Drake recorded 11 hits with Emily Valtman and Macy Johnson both going 3-4. Evansville picked up six hits with Barela going 2-for-3 with a pair of home runs.
Sunday’s series finale is set for a 12 p.m. first pitch.

The COVID-19 pandemic exposed vast disparities in health care not only in access to care and patient outcomes but also in the inequities of hospitals’ pay for different employees. While some hospital executives took modest pay cuts for a few months to make up for financial losses, more than 80 percent of hospitals continued to provide CEO bonuses, even as other hospital workers were furloughed or had their pay slashed. As is often the case, one story can tell a much larger and more important story. Last year, a hospital technician whose take-home pay was $30,000 per year contracted COVID-19 on the job. Upon his return to work, he was named employee of the month and given a $6 gift voucher for the hospital cafeteria. The hospital system CEO—who was not on the frontlines of COVID-19—received a 13 percent boost in his total compensation, which was worth $30.4 million.
While such glaring chasms in pay are not unique to hospitals, the pandemic has triggered the question of whether executive compensation should be part of the broader discussion about equity within our health care system, especially as minorities and women are often the employees at the lower end of the wage spectrum. Moreover, the impact of hospital employee wages goes beyond the individual. Since hospitals are often the largest single employer in their region, the salaries they pay their workers may have a significant impact on the financial stability and income security of the entire community.
This story and the embedded facts raise two key questions: How big is the gap between the pay of the workforce and the CEO, and what are the implications? We explore these questions using new data and insights from a recent study conducted by the Lown Institute.
In the world of nonprofit pay scales for executives, hospitals are outliers. A 2021 report from the Economic Research Institute (ERI) found that the average annual CEO pay in most nonprofit industries was between $100,000 and $200,000 in 2018. The two exceptions were university CEOs, who were paid an average of $350,000, and hospital CEOs, who were paid on average $600,000. But the average belies the true dimensions of executive salaries in health care systems. In 2018, Bernard Tyson, then-CEO of nonprofit health care giant Kaiser Permanente, made nearly $18 million, making him the highest-paid nonprofit CEO in the nation. The previous year, the top 10 highest paid nonprofit health system executives each made $7 million or more. Even the bottom 25 percent of nonprofit hospital CEOs enjoyed annual compensation of about $185,000 according to ERI—more than the highest-paid quartile for CEOs in nonprofit arts and culture, environmental, human services, and religion-related organizations.
These differences hold even when comparing nonprofits with similar revenues in health care and in other areas. The highest-paid executive of the American Red Cross, a national nonprofit with 600 chapters and revenue of $3.6 billion, received about $800,000 in total compensation in 2018. In comparison, the president and CEO of the Ochsner Clinic Foundation, a large academic health system hospital in New Orleans with revenue of $3.4 billion, made $5 million in compensation the same year—about the same amount as the 10 highest-paid executives from the American Red Cross combined.
The wide divergence between nonprofit hospital CEO compensation and other nonprofit entities prompted us to examine hospital pay equity as part of the Lown Institute Hospitals Index, a big-data project launched in 2020. For the hospital pay equity metric, we compared the difference between top executive compensation and the average wage of hospital staff without advanced degrees. We included lower-wage staff, such as janitorial and kitchen staff, and medical-records personnel, and excluded professional staff such as physicians and nurse practitioners, whose jobs require specialized degrees. We used information from Internal Revenue Service (IRS) 990 forms, the Centers for Medicare and Medicaid Services, and the Bureau of Labor Statistics for the year 2018 (the latest available data).
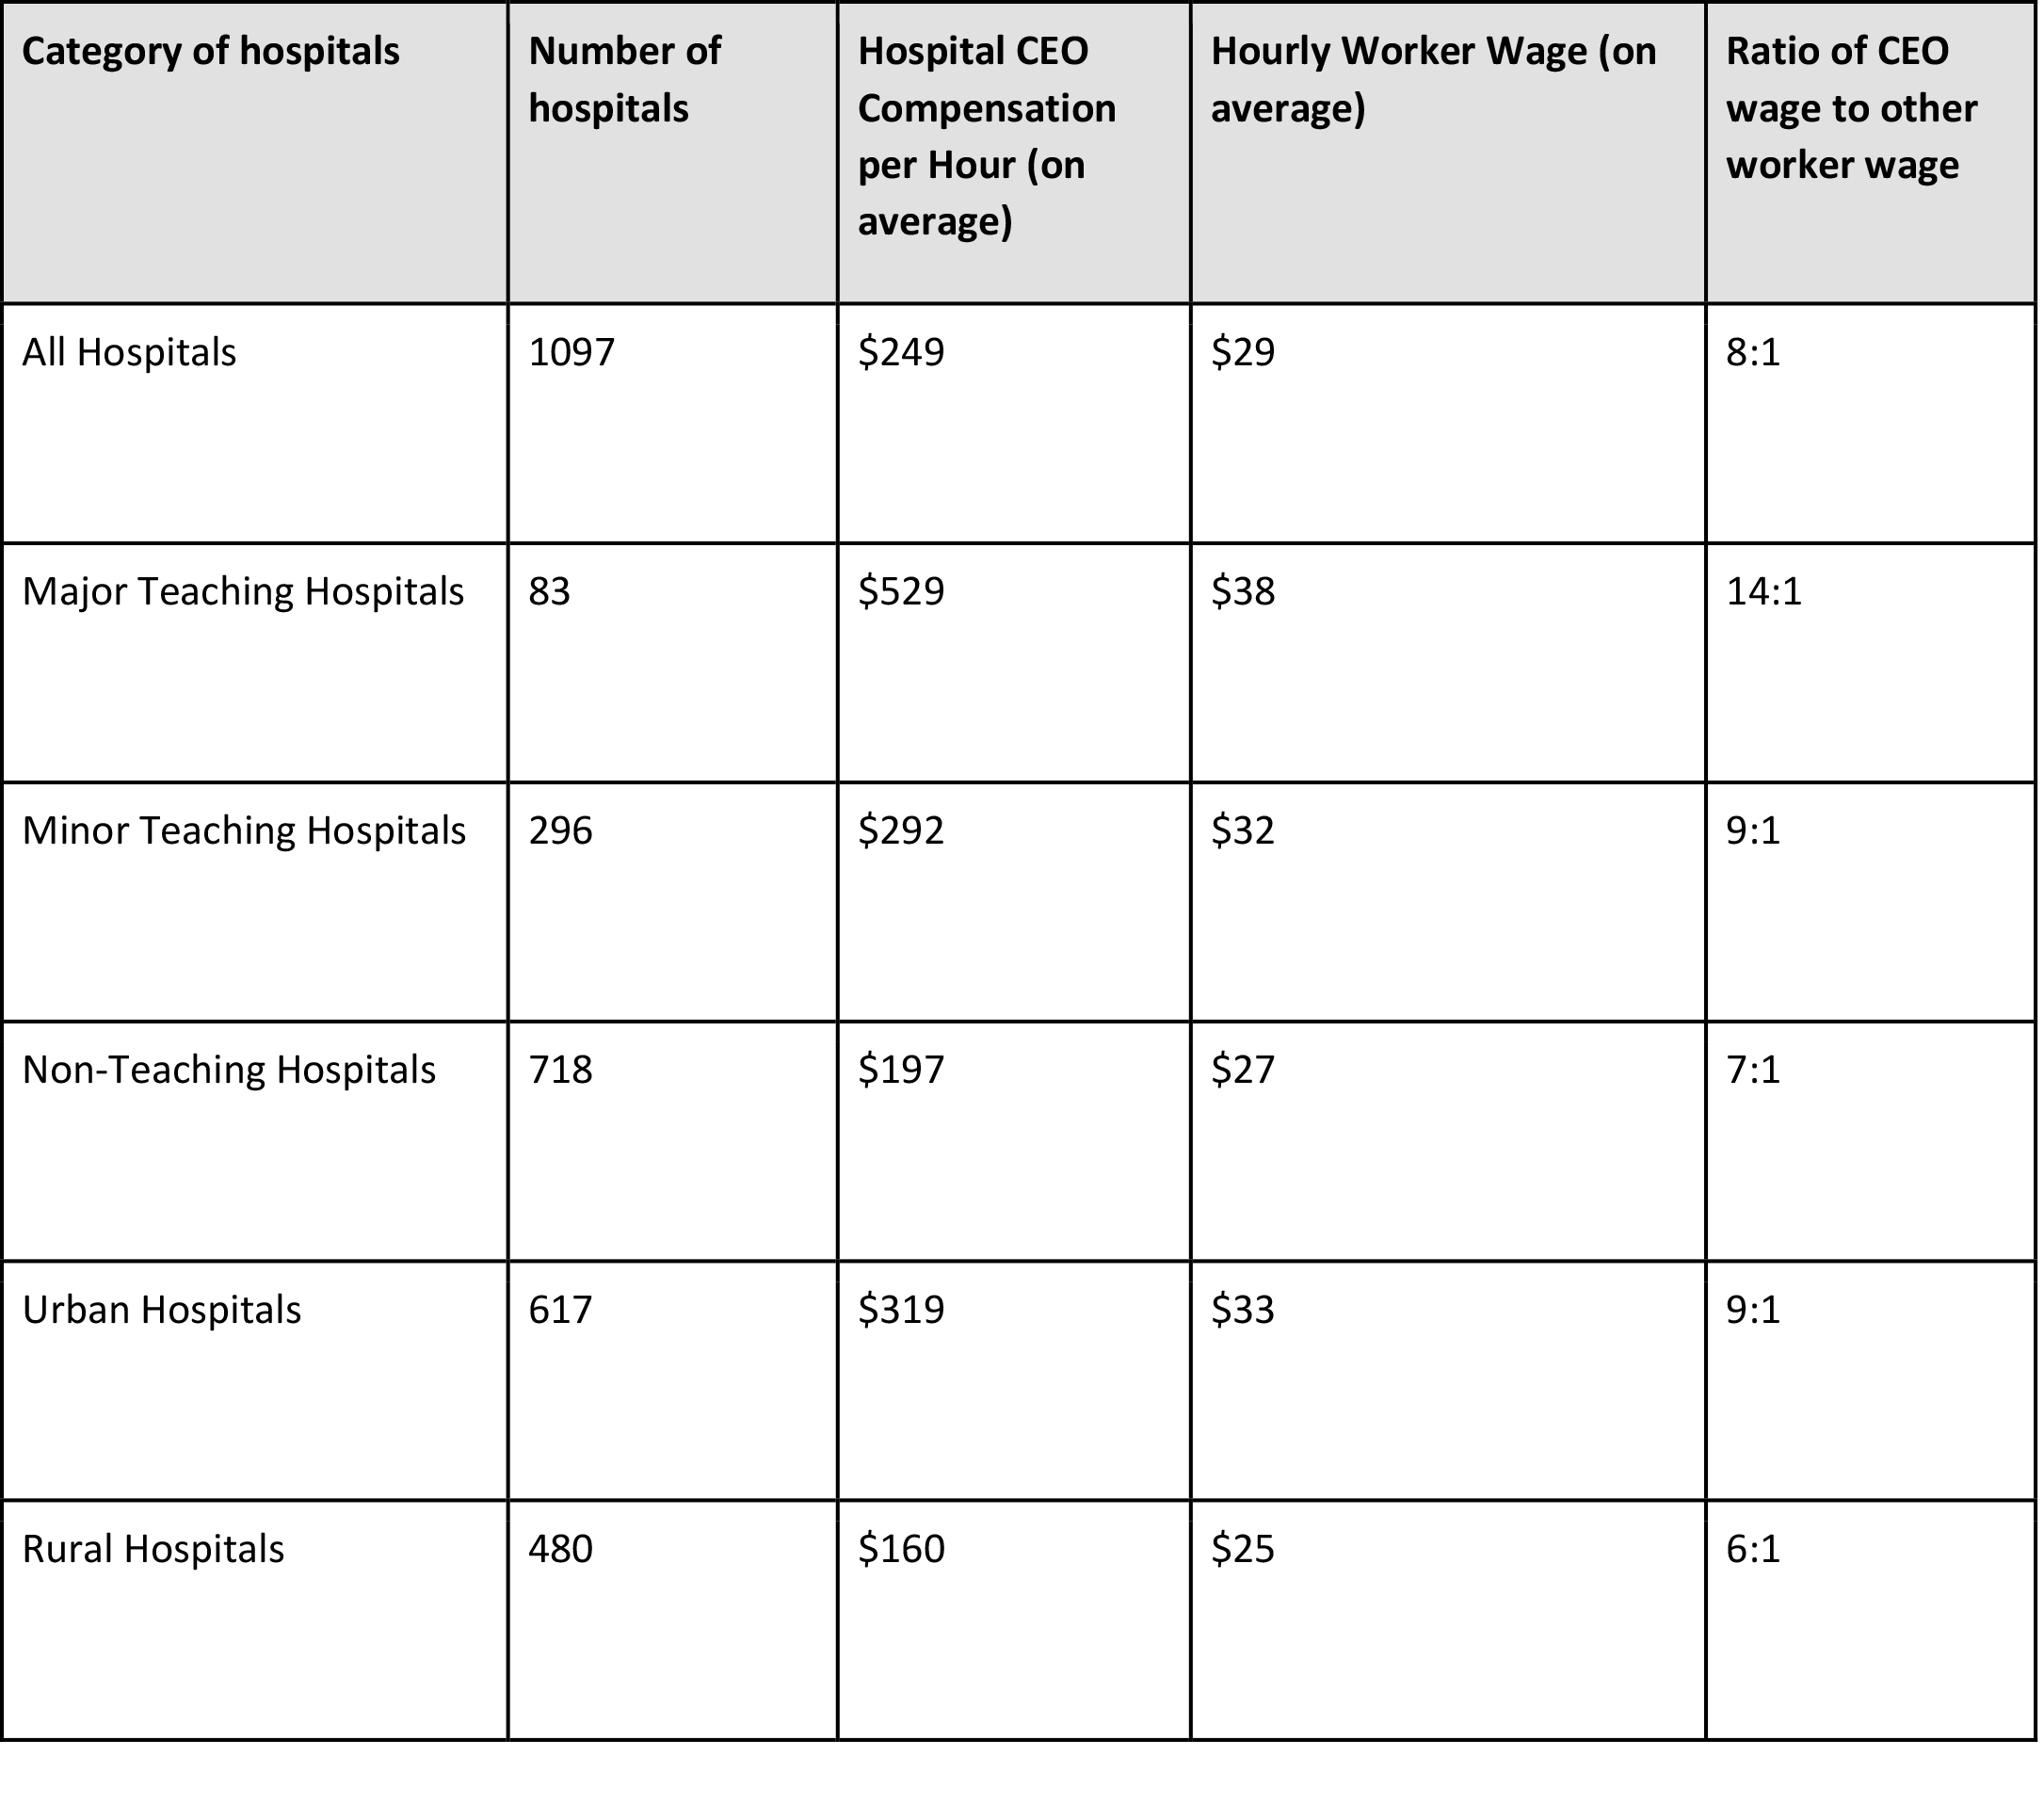
In calculating the index, we imputed missing values; we also allocated system CEO salaries to individual hospitals pro-rata by revenue share. For the analysis we report below, however, we focused on the subset of 1,097 nonprofit hospitals on the Lown Index, for which pay equity was calculated without any imputation or prorating. Only hospitals that had executive compensation data available for the facility in IRS 990 forms are included in this subset. We used a 40-hour workweek to translate annual salary and bonus figures into hourly wages.
Within this set of more than 1,000 nonprofit hospitals, we found that hospital executives on average made eight times the wages of workers without advanced degrees in 2018.
However, this ratio varied widely. Some hospital CEOs were paid at twice the rate of other workers, while the highest-paid received 60 times the hourly pay of general workers (see exhibit 1).
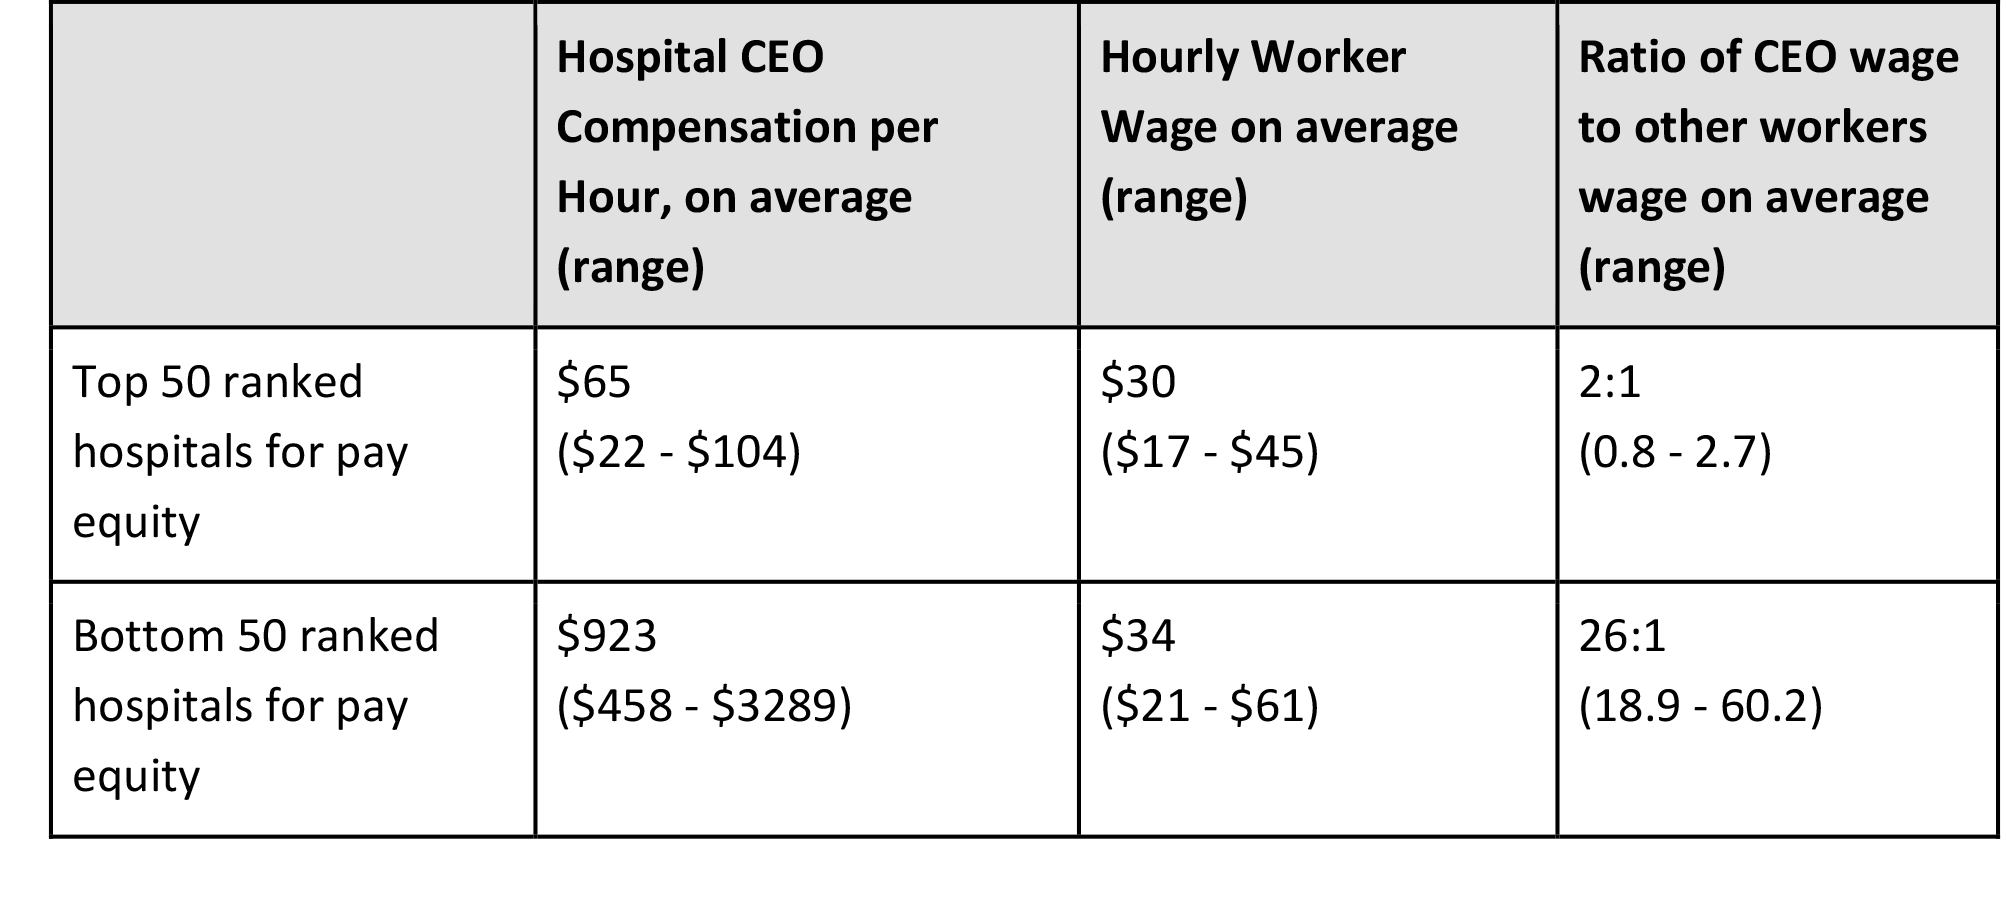 Source: Authors’ calculations based on Lown Institute Hospitals Index.
Hospital CEOs are compensated primarily for the volume of patients that pass through their doors—so-called “heads in beds.†Previous research on hospital executive compensation finds that higher compensation is strongly associated with the number of beds, at a rate of an additional $550 in salary per bed. Another study of 35 CEOs at Connecticut nonprofit hospitals found that from 1998 to 2006 they were incentivized to increase the volume of privately insured patients at the expense of those with public or no insurance. This is part of the underlying business model that drives the nonprofit hospital landscape: Volume matters, and high-margin volume matters the most for the bottom line. We see the relationship between hospital size and executive compensation in exhibit 2 below. Although both CEO compensation and worker wage increase in a stepwise fashion as hospital size increases, the increase in CEO compensation tends to exceed that of worker pay for larger hospitals, giving them a higher pay equity ratio.
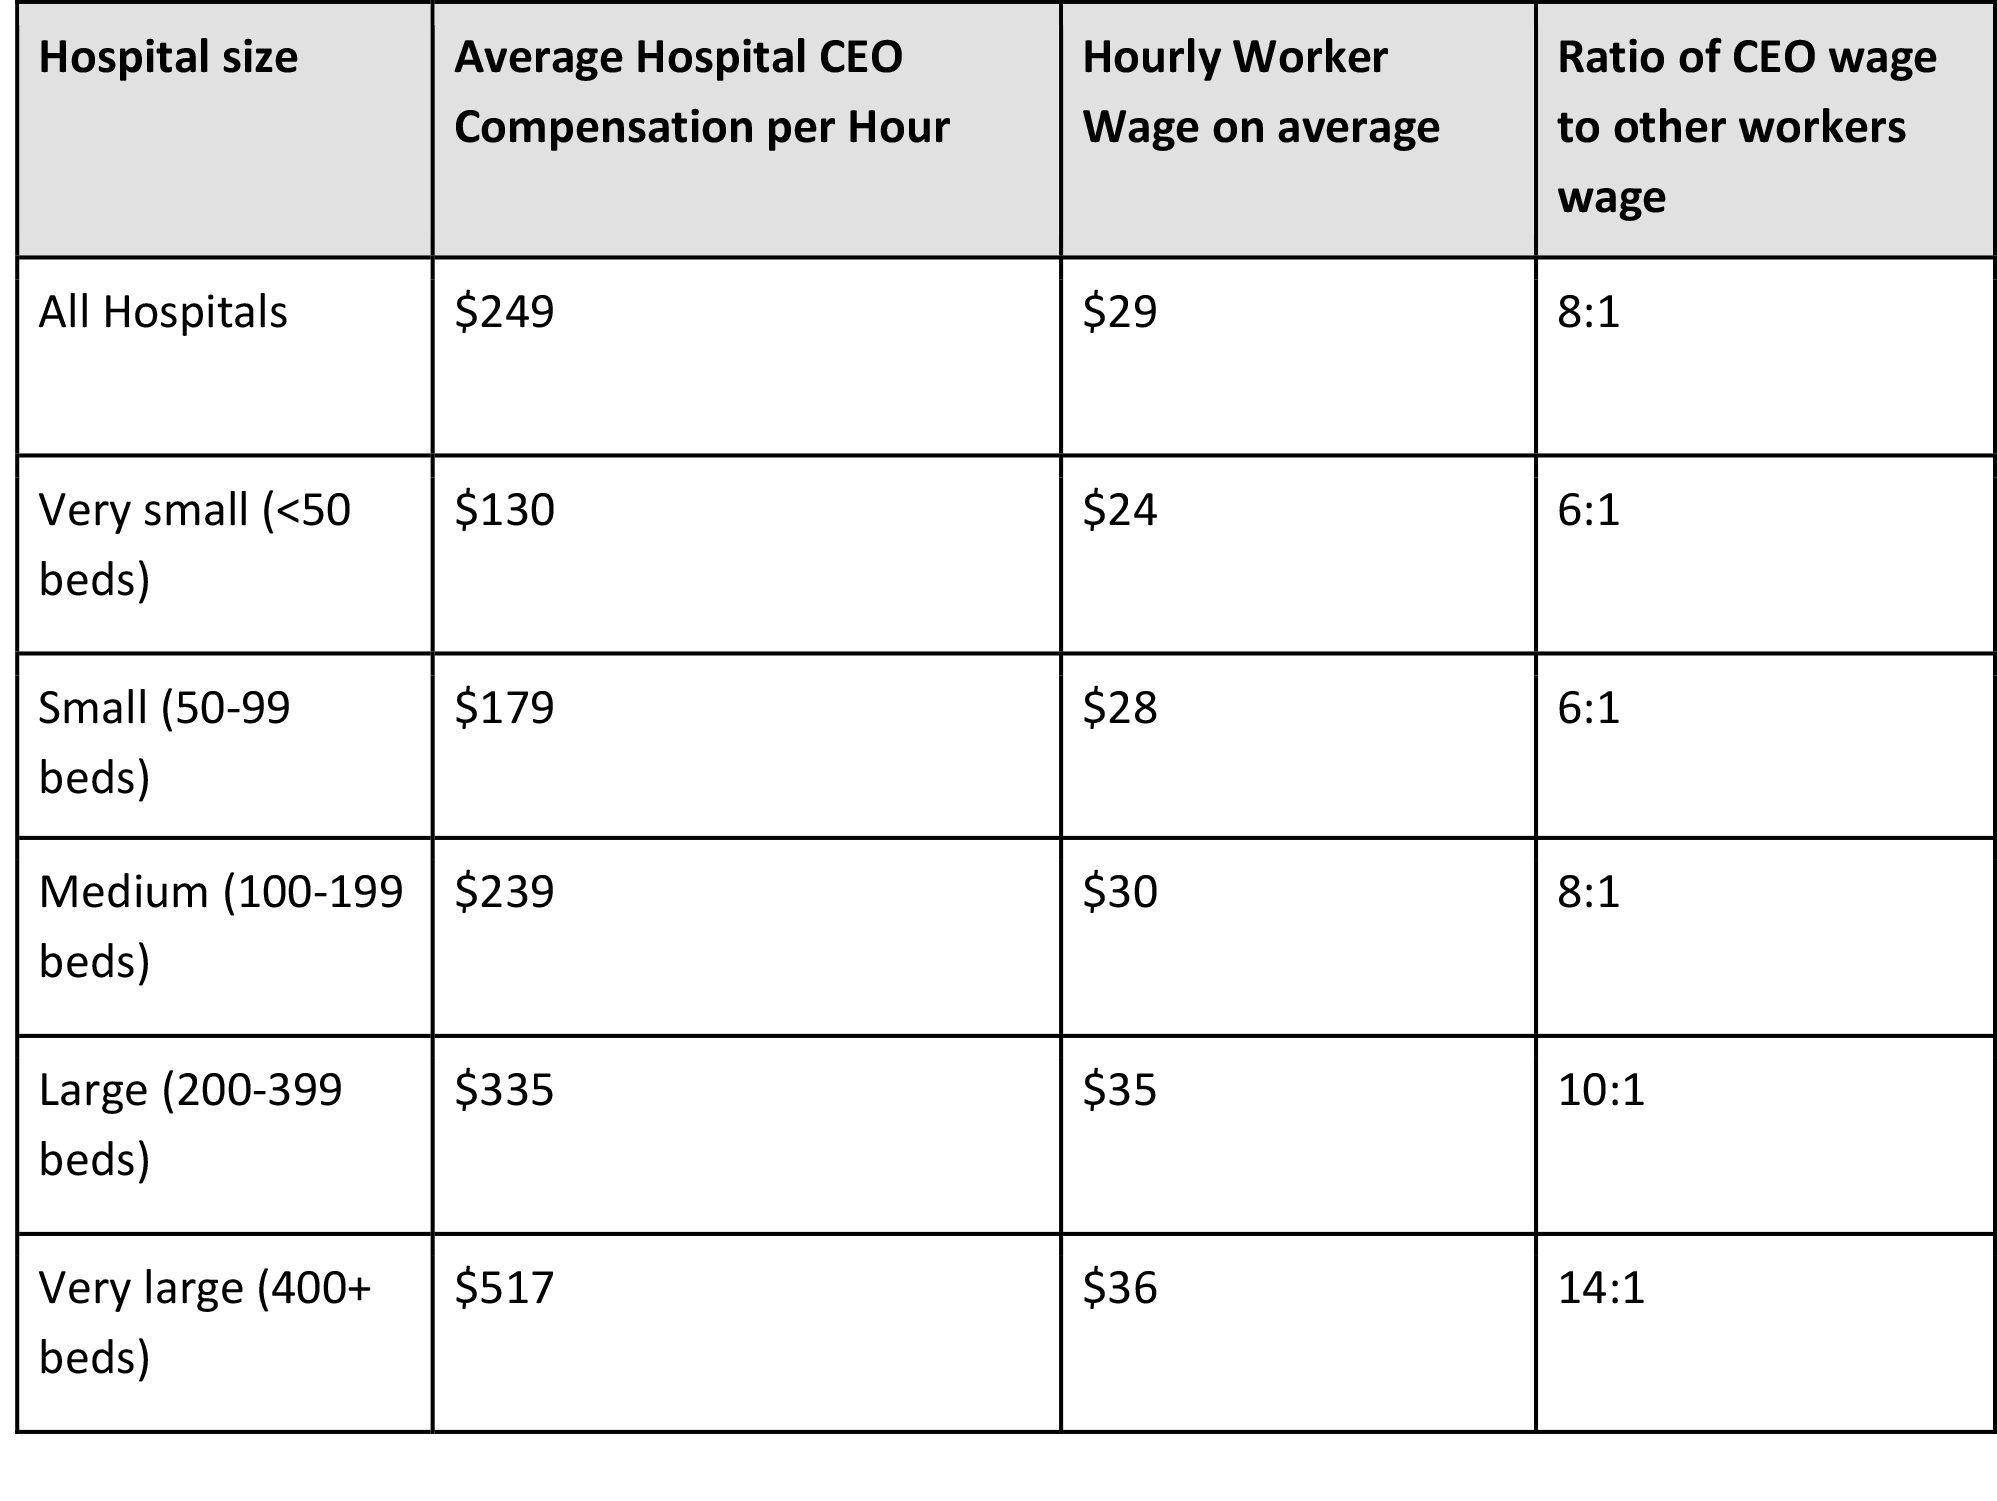
Source: Authors’ calculations based on Lown Institute Hospitals Index.
Size is not the only characteristic that matters for pay equity. Among larger hospitals with 400 or more beds, there was still significant variation in hourly executive compensation, ranging from $88 to $3,289 per hour. According to the Lown Index data, urban location and teaching status are also associated with higher executive hourly compensation compared to general worker wages, which supports findings from previous research as well (see exhibit 3).
 Source: Authors’ calculations based on Lown Institute Hospitals Index.
Yet, there are continued discrepancies in compensation unexplained by location, hospital size, and hospital type. We found variation in executive compensation among large teaching hospitals and small nonteaching hospitals alike, even those located in the same cities (see exhibit 4 for examples). In some cities, similar hospitals pay their CEOs two-four times the hourly rate other hospitals do, despite paying their workers without advanced degrees similar or lower rates.

Hospitals in certain Mid-Atlantic/New England states had especially high rates of executive compensation compared to average worker wage. In Connecticut and Maryland, CEOs made 13 times the average hourly worker’s wage, while in Delaware, New York, and New Jersey, CEOs made 12, 11, and 10 times average hourly wages, respectively. By comparison, hospitals in some Midwestern and Great Plains states had much lower rates. In Idaho, Mississippi, and North Dakota, CEOs made about five times the average hourly worker’s wage. Hospitals in Nebraska, South Dakota, Wyoming, Kentucky, Washington State, and Arkansas also had average ratios below six.
Although COVID-19 brought hospital finances and pay scales to greater public awareness, the rise of nonprofit hospital CEO pay has been decades in the making. Hospital revenue began to climb in the 1960s with the advent of Medicare and increasing insurance coverage. With increased revenue came a shift in attitude that helped transform many hospitals from community-focused nonprofits into big businesses. Hospitals began hiring more administrative staff, restructured their boards to include more leaders from the corporate sector, and even changed their mission statements to reflect the increasing importance of financial considerations.
Naturally, the new corporate members of hospital boards brought their values and experience from the for-profit world into the governance culture of the hospital. Today, hospital boards compare the compensation of their CEOs not to other community-based nonprofits but to their for-profit publicly traded hospital CEO peers, who themselves are compared to leaders in the largest industrial and financial companies trading on Wall Street. Since many boards set CEO salaries by obtaining “comparable†salary data, this becomes an ever-spiraling upward cycle.
As hospital policies and culture have become more aligned with big businesses, hospital executive compensation has swelled, mirroring the climb in CEO wages across all of corporate America that began in the late 1970s and continued despite the Great Recession that began in 2008. According to the Economic Policy Institute, the average realized compensation of US CEOs, adjusted for inflation, grew by 105.0 percent from 2009 to 2019, while typical worker compensation increased by just 7.6 percent. Similarly, from 2005 to 2015, the average compensation of major nonprofit hospital CEOs rose by 93 percent, from $1.6 million to $3.1 million, while average hospital worker wages increased by a mere 8 percent in that decade.
Our collective experience with the COVID-19 pandemic has provided an opportunity for the public, hospital boards, policymakers, and regulators to reflect on recent trends in hospital compensation and to rethink how we should pay nonprofit hospital CEOs. Hospital boards in particular, as the final arbiters of CEO pay, should consider the following questions:
Our opinion is that as institutions dedicated to the public good and the health of their local communities, nonprofit hospitals should be measured by the value they create—both business value and social value. It is clear that size alone does not equal value. In the real world, a CEO of a 1,000-bed hospital is compensated more because more dollars are flowing through the institution, not because the job is that much harder than that of a CEO of a 500-bed hospital. They are rarely if ever compensated on the basis of their stewardship of the community’s health.
As a society, we need to develop a set of factors that gives CEOs incentives to fulfill the hospital’s social mission. For example, CEOs could be rewarded for improving clinical outcomes, patient safety, and racial health disparities. They could be rewarded for being good stewards of public monies by improving cost efficiency. The complexity of the job should also be considered, not only based on the size of the hospital or system but also the hospital’s patient mix and a financial cushion. Currently, hospitals with a wealthier and well-insured patient mix tend to pay their executives the most, although arguably hospitals that care for more publicly insured or uninsured patients and have chronically thin margins require more skill to manage successfully.
It’s time for a public discussion of these issues. In creating our pay equity metric, we sought to create a platform for this much-needed conversation. We hope it is the start of a long process that will engage all stakeholders in discussing the importance of aligning incentives to create real value in US health care.
Posted by the City-County Observer without bias or editing.
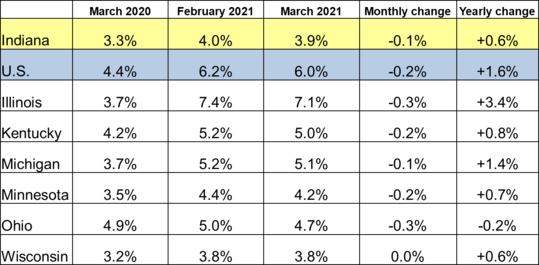
INDIANAPOLIS  Indiana’s unemployment rate stands at 3.9 percent for March, and the national rate is 6.0 percent. The monthly unemployment rate is a U.S. Bureau of Labor Statistics (BLS) indicator that reflects the number of unemployed people seeking employment within the prior four weeks as a percentage of the labor force.
Indiana’s labor force had a net decrease of 5,895 over the previous month. This was a result of a decrease of 3,644 unemployed residents and a decrease of 2,251 employed residents.
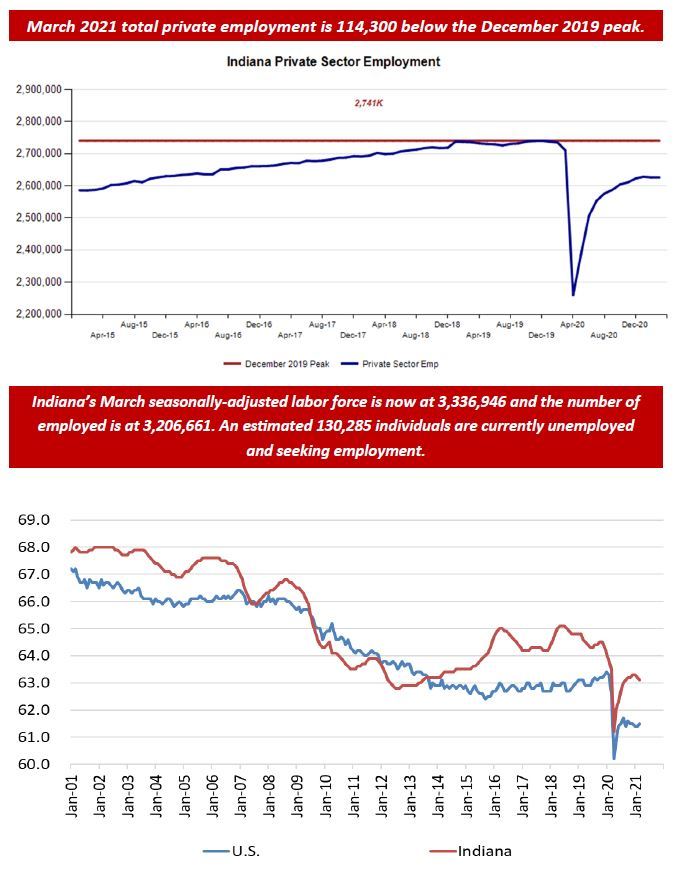
Indiana’s total labor force, which includes both Hoosiers employed and those seeking employment, stands at 3.34 million, and the state’s 63.1 percent labor force participation rate remains above the national rate of 61.5 percent.
Learn more about how unemployment rates are calculated here: http://www.hoosierdata.in.gov/infographics/employment-status.asp.
Employment by Sector
Private sector employment has decreased by 84,600 over the year and decreased by 100 over the previous month. The monthly decrease is primarily due to losses in the Professional and Business Services (-3,700) and the Trade, Transportation and Utilities (-3,000) sectors. Losses were offset by gains in the Construction (3,300) and the Leisure and Hospitality (3,100) sectors. Total private employment stands at 2,626,200, which is 114,300 below the new December 2019 peak.
Midwest Unemployment Rates
EDITOR’S NOTES:
Data are sourced from March Current Employment Statistics, Local Area Unemployment Statistics – U.S. Bureau of Labor Statistics
March employment data for Indiana Counties, Cities and MSAs will be available Monday, April 19, 2021, at noon (Eastern) pending U.S. Bureau of Labor Statistics validation.
|
|
|
Indiana Small Business Restart Grant Applications Open
Some artists and small businesses may be eligible to receive a Small Business Restart Grant from the Indiana Small Business Development Center.
Those who meet the eligibility requirements can apply for reimbursement for qualified business expenses incurred between March 1, 2020, and May 1, 2021. Nonprofit organizations do not qualify for this program.
Eligible small businesses are encouraged to apply and submit expenses for reimbursement as soon as possible; grants will be issued in the order in which applications are received until funding is exhausted or until the program expires.
Evansville Central High School graduate Logen Sitzman is gaining experience as an intern with State Rep. Wendy McNamara (R-Evansville) and her fellow members of the Indiana House of Representatives during the 2021 legislative session.
Sitzman, an Evansville resident, is the son of Mark and Sandy Sitzman. He graduated from the University of Evansville with a bachelor’s degree in communications in December 2020.
“I am grateful for this internship opportunity because I have the chance to watch Indiana’s legislators work behind the scenes,” Sitzman said. “Getting to see the ins and outs of the legislation is extremely rewarding.”
As a legislative intern, Sitzman corresponds with constituents through phone calls, letters and emails while also staffing committee hearings.
“Gaining hands-on experience is a very important part of learning and developing the skills needed to be successful,” McNamara said. “Our interns help so much throughout the session, and I look forward to seeing where the future takes Logen.”
Each year, the Indiana House of Representatives offers paid internship opportunities to college students, law school students, graduate students and recent college graduates for the duration of each legislative session.
Visit IndianaHouseRepublicans.com/internship for more information about the House Republican Internship Program.
 A new Gold Star Families Memorial Monument (GSFMM) honoring the families of servicemen and women who sacrificed their lives while serving in the military is currently being planned in Indianapolis. The memorial dedication event is 1:30 p.m. May 1. See more information atÂ
A new Gold Star Families Memorial Monument (GSFMM) honoring the families of servicemen and women who sacrificed their lives while serving in the military is currently being planned in Indianapolis. The memorial dedication event is 1:30 p.m. May 1. See more information at