


LINK TO CAMPAIGN REPORTS FOR INDIVIDUALS RUNNING FOR POLITICAL OFFICE IN THE MAY 2, 2023 PRIMARY ELECTION IS POSTED BELOW
Diana Moers Bio

Diana Moers was sworn into office in January of 2023 after being elected the first woman in Vanderburgh County history to hold the office of Prosecutor. As the elected Prosecutor, Moers is responsible for a staff of over 80 employees. The office of the Prosecutor is charged with prosecuting all crimes committed in Vanderburgh County, collecting child support, and a number of community outreach responsibilities. Moers is an Evansville native and graduated from North High School.Â
Prior to being elected Vanderburgh County Prosecutor, Moers served as section chief for the government litigation section of the Indiana Attorney General—the largest of the litigation sections. In this role, she oversaw the State’s attorneys handling a range of federal and state litigation cases and assisted the Solicitor General as needed.
Before joining the Office of Attorney General, Diana served as Executive Director of the Indiana board for depositories under State Treasurer Kelly Mitchell. In her role as Executive Director, Diana worked with the Board (which includes the Governor’s office, the State Auditor, Treasurer, Director of the State Board of Accounts, Director of the Indiana Department of Finance, as well as Bank and Credit Union CEOs), to ensure the safety of Indiana’s public funds in the event of bank fraud or failure.
Prior to her work with the Treasurer, Diana served at the Secretary of State’s Office at the Prosecution Assistance Unit – an arm of the Indiana Securities Division which aids prosecutors around Indiana in the prosecution of violations of the Indiana Securities and Loan Broker Acts. Additionally, Diana was an enforcement attorney for the division – a branch of the Indiana Secretary of State’s office charged with overseeing the state’s investment and financial protection industry. Upon consultation with local prosecutor’s offices, Diana was sworn-in as a special prosecutor within multiple jurisdictions to handle cases developed by the Indiana Securities Division.

MAYORAL CANDIDATE CHERYL MUSGRAVE SHARES HER LIFE EXPERIENCES

Last year, after a lot of thought and consultation with my family, I decided to run for Mayor of Evansville.
Evansville deserves better.
Let me share something about my background. I wasn’t born in Evansville–but I got here as soon as I could.
My father was in the U.S. Air Force. That’s why I was born in West Germany. It’s why my first memories are of Naples, Italy. Our family followed my father’s postings around Europe and America for the whole of my childhood.
I’ve been working since I was 14 years old. From babysitting full-time in the summers during high school to waiting for restaurant tables, catering, McDonald’s, mowing grass, and painting, I did whatever it took to move out of the genteel poverty of my childhood. At times this included sewing my own clothes and it always meant never eating out. Unless it was at the restaurant I was working for.Â
I worked these same jobs during college, where I was a Pell Grant student. Â
As an adult, I worked in law firms, including 6 years setting up my husband’s law practice with him. He had to hire three people to replace me when I was elected County Assessor.Â
My private sector experience has always informed my work as an elected official. I know just how hard it is for families to make ends meet. The kitchen table is not always loaded with food; it is often covered in bills and spreadsheets and calculations to make ends meet.Â
Those experiences taught me about duty and service. And it also taught me what it takes to make a home.
I’ve made my home in Evansville. I raised two children here. Now, two granddaughters live here. And I want Evansville to be the best it can be for them–and for all of us, and for all of our families.
Making Evansville the best it can be will take a mayor who can lead. As County Commissioner, I’ve worked with my colleagues. We brought raises for sheriffs, new cycling and running paths, a better Burdette Park, and universal broadband to the unincorporated county.  I’ve shown that I can lead.
In my career, I’ve learned how experienced public servants can help their communities thrive. Even what seem like small details require your full attention from the beginning.
I know being your mayor will be a challenge. But I also think it’s my duty–for my family and for the city I’ve chosen as my home.
Being mayor is a big job.
The next mayor will need to restore leadership to our police. She will have to clean up the parks and pave the roads. Over four years, she will oversee more than one point six billion dollars in spending. Hundreds of people will work under her direction.
Who do you trust with that responsibility?
As a candidate, it’s my duty to convince you that I’m the best person for the job. As citizens, you have the most important task: choosing the right candidate.
My record shows I can make tough decisions.
My experience shows that I can work as part of a team–and I work across party lines.
I am ready to work for you. From day one. Make the best choice for Evansville.
Cheryl

Large Southern Cities Lead Nation in Population Growth

Large Southern Cities Lead Nation in Population Growth
Texas Continues to Top the Charts With Fastest-Growing Cities
MAY 30, 2023 — Nine of the nation’s 15 fastest-growing cities were in the South, according to Vintage 2022 Population Estimates released today by the U.S. Census Bureau. Of the nine fastest-growing cities in the South, six were in Texas. New estimates for metropolitan and micropolitan statistical areas and for housing units at the national, state and county levels were also released today.

“Georgetown, Texas, remained the fastest-growing city by percent change in 2022, with the highest rate of growth among all U.S. cities and towns with at least 50,000 people. It wasn’t the only city to retain its distinction over the year, however,†said Crystal Delbé, a statistician in the Census Bureau’s Population Division. “New York remained the nation’s largest city, despite its recent population decline. At 8.3 million, its population was more than twice that of the next largest city, Los Angeles, with a population of nearly 4 million.â€
Following the population increase of 14.4% in Georgetown, Texas, was Santa Cruz, California, with a 12.5% increase, adding roughly 7,000 people to its population. The next three fastest-growing cities were also in Texas — Kyle, Leander, and Little Elm.
Texas was the only state that had more than three cities on both the 15 fastest-growing large cities and towns by numeric change and by percent change lists. Fort Worth, Texas, had the largest numeric population gain in 2022, with an increase of 19,170 people. Phoenix, Arizona (19,053); San Antonio, Texas (18,889); Seattle, Washington (17,749); and Charlotte, North Carolina (15,217), rounded out the top five cities by numeric growth.
Most Populous Cities
Charlotte, North Carolina, returned to the list of the top 15 largest cities in 2022, ranking 15th after dropping to 16th in 2021.
Following New York and Los Angeles in population size were
- Chicago, Illinois (2.7 million).
- Houston, Texas (2.3 million).
- Phoenix, Arizona (1.6 million).
- Philadelphia, Pennsylvania (1.6 million).
- San Antonio, Texas (1.5 million).
- San Diego, California (1.4 million).
- Dallas, Texas (1.3 million).
- Austin, Texas (1.0 million).
- Jacksonville, Florida (1.0 million).
- San Jose, California (1.0 million).
- Fort Worth, Texas (1.0 million).
- Columbus, Ohio (907,971).
Population Change in Small Towns and Regional Differences
While nearly 40% (129.6 million) of the nation’s population lived in the 4.1% (798) of cities with populations of 50,000 or more, the United States remained a nation of small towns. Of approximately 19,500 incorporated places, about 75% had fewer than 5,000 people and nearly 33% had fewer than 500.
On average, these small towns experienced uneven growth across U.S. regions:
- Northeast small towns declined by 0.4%.
- Midwest small towns declined by 0.2%.
- Small towns in the South grew by 0.4%.
- Western small towns saw the largest growth from 2021 to 2022, with an increase of 0.5%.
Other Highlights
Crossing population milestones:
- Three cities joined the list of cities with populations of 50,000 or more in 2022 — Wake Forest, North Carolina (51,113); Rockwall, Texas (51,461); and Eagle Mountain, Utah (54,149).
- Two cities in Texas crossed the 100,000 population mark in 2022 — Conroe (101,405) and New Braunfels (104,707).
Metropolitan and Micropolitan Statistical Areas
Metropolitan statistical areas:
- U.S. metro areas grew by approximately 0.4% between 2021 and 2022.
- Roughly two-thirds (65.1%) of the 384 U.S. metro areas saw increases in population between 2021 and 2022.
- The New York-Newark-Jersey City, NY-NJ-PA metro area was the most populous with a population of 19,617,869 as of July 1, 2022, a decrease of 156,517 from July 1, 2021, with the Los Angeles-Long Beach-Anaheim, CA metro area being the second-most populous with a 2022 population of 12,872,322, a decrease of 100,525 from 2021.
- Ten U.S. metro areas had populations of at least 5 million in 2022, with six of the ten increasing in population between 2021 and 2022.
- The Phoenix-Mesa-Chandler, AZ metro area surpassed the 5 million population threshold between 2021 and 2022.
- The Dallas-Fort Worth-Arlington, TX metro area had the highest numeric increase in population between 2021 and 2022 of any U.S. metro area, with an annual jump of 170,396 people, followed by the Houston-The Woodlands-Sugar Land, TX metro area which added 124,281 residents over the same time period.
- The Villages, FL metro area was the fastest-growing U.S. metro area between 2021 and 2022, increasing by 7.5%.
Micropolitan statistical areas:
- U.S. micro areas grew by approximately 0.1% between 2021 and 2022.
- Approximately 45% of the 543 U.S. micro areas saw increases in population between 2021 and 2022.
- The Pullman, WA micro area had the largest numeric and percent increase of all U.S. micro areas between 2021 and 2022, adding 4,381 people (10.1%).
- The Susanville, CA micro area had the largest numeric and percent decrease of all U.S. micro areas between 2021 and 2022, declining by 1,909 people (-6.0%).
Modest Housing Unit Growth in Nearly All States
The nation’s housing stock grew by about 1.6 million units between July 2021 and July 2022, reaching a total of 143.8 million with an annual growth rate of 1.2%. This represents a slight increase from the 1.0% in 2020-2021.
- California had the largest number of housing units (14.6 million), followed by Texas (12.1 million) and Florida (10.3 million), while Wyoming (277,116) and Alaska (329,285) had the fewest housing units.
- Utah experienced the nation’s fastest growth in housing units, with an increase of 3.3% between July 1, 2021, and July 1, 2022, followed by Idaho (2.8%) and Texas (2.3%). Rhode Island (0.2%), New Jersey (0.2%), Illinois (0.2%) and Connecticut (0.3%) had the slowest rates of housing growth.
- Harris County, Texas (32,694); Maricopa County, Arizona (28,051); Travis County, Texas (27,927); Philadelphia County, Pennsylvania (24,701); and Los Angeles County, California (21,738), were the five counties with the largest numeric gains in housing units between July 1, 2021, and July 1, 2022.
- Wasatch County, Utah, was the fastest-growing county; its housing stock increased by 7.7% between July 1, 2021, and July 1, 2022, followed by Rockwall County, Texas (7.4%), and St. Johns County, Florida (6.6%). Jasper County, South Carolina, and Teton County, Idaho were tied for fourth with 6.4%.
- Bristol City, Virginia, Martinsville City, Virginia, and Grant County, Nebraska, had the largest percent decreases in housing units between 2021 and 2022 with -0.3%.
The complete list of counties is available in the data visualization, A Snapshot of the Nation’s Housing Stock
| Table 1. The 15 Fastest-Growing Large Cities Between July 1, 2021, and July 1, 2022, With Populations of 50,000 of More on July 1, 2021 | ||||
| Rank | Area Name | State | Percent Increase | 2022 Total Population |
| 1 | Georgetown city | Texas | 14.4 | 86,507 |
| 2 | Santa Cruz city | California | 12.5 | 61,800 |
| 3 | Kyle city | Texas | 10.9 | 57,470 |
| 4 | Leander city | Texas | 10.9 | 74,375 |
| 5 | Little Elm city | Texas | 8.0 | 55,357 |
| 6 | Westfield city | Indiana | 7.7 | 54,605 |
| 7 | Queen Creek town | Arizona | 6.7 | 70,734 |
| 8 | North Port city | Florida | 6.6 | 85,099 |
| 9 | Cape Coral city | Florida | 6.4 | 216,992 |
| 10 | Port St. Lucie city | Florida | 6.4 | 231,790 |
| 11 | Conroe city | Texas | 6.3 | 101,405 |
| 12 | Maricopa city | Arizona | 6.2 | 66,290 |
| 13 | New Braunfels city | Texas | 5.7 | 104,707 |
| 14 | Lehi city | Utah | 5.6 | 84,373 |
| 15 | Medford city | Massachusetts | 5.2 | 65,399 |
| Source: U.S. Census Bureau, Population Division, Vintage 2022 Population Estimates, release date: May 2023. | ||||
| Table 2. The 15 Cities With the Largest Numeric Increases Between July 1, 2021, and July 1, 2022, With Populations of 50,000 of More on July 1, 2021 | ||||
| Rank | Area Name | State | Numeric Increase | 2022 Total Population |
| 1 | Fort Worth city | Texas | 19,170 | 956,709 |
| 2 | Phoenix city | Arizona | 19,053 | 1,644,409 |
| 3 | San Antonio city | Texas | 18,889 | 1,472,909 |
| 4 | Seattle city | Washington | 17,749 | 749,256 |
| 5 | Charlotte city | North Carolina | 15,217 | 897,720 |
| 6 | Jacksonville city | Florida | 14,408 | 971,319 |
| 7 | Port St. Lucie city | Florida | Â Â Â Â Â Â Â Â Â Â Â Â Â 13,887 | 231,790 |
| 8 | Cape Coral city | Florida | 13,017 | 216,992 |
| 9 | Houston city | Texas | 11,223 | 2,302,878 |
| 10 | Georgetown city | Texas | 10,887 | 86,507 |
| 11 | North Las Vegas city | Nevada | 9,419 | 280,543 |
| 12 | Henderson city | Nevada | 8,994 | 331,415 |
| 13 | Dallas city | Texas | 8,833 | 1,299,544 |
| 14 | Irvine city | California | 8,589 | 313,685 |
| 15 | Frisco city | Texas | 8,506 | 219,587 |
| Source: U.S. Census Bureau, Population Division, Vintage 2022 Population Estimates, release date: May 2023. | ||||
| Table 3. The 15 Most Populous Cities on July 1, 2022 | |||
| Rank | Area Name | State | 2022 Total Population |
| 1 | New York city | New York | 8,335,897 |
| 2 | Los Angeles city | California | 3,822,238 |
| 3 | Chicago city | Illinois | 2,665,039 |
| 4 | Houston city | Texas | 2,302,878 |
| 5 | Phoenix city | Arizona | 1,644,409 |
| 6 | Philadelphia city | Pennsylvania | 1,567,258 |
| 7 | San Antonio city | Texas | 1,472,909 |
| 8 | San Diego city | California | 1,381,162 |
| 9 | Dallas city | Texas | 1,299,544 |
| 10 | Austin city | Texas | 974,447 |
| 11 | Jacksonville city | Florida | 971,319 |
| 12 | San Jose city | California | 971,233 |
| 13 | Fort Worth city | Texas | 956,709 |
| 14 | Columbus city | Ohio | 907,971 |
| 15 | Charlotte city | North Carolina | 897,720 |
| Source: U.S. Census Bureau, Population Division, Vintage 2022 Population Estimates, release date: May 2023. | |||
| Table 4. Total Population Living in Cities and Towns by Population Size as of July 1, 2022 | ||
| Population Size | Number of Cities and Towns | Total Population |
| Under 5,000 | 14,667 | 16,293,055 |
| 5,000 to 9,999 | 1,659 | 11,816,669 |
| 10,000 to 49,999 | 2,369 | 52,034,801 |
| 50,000 and Over | 798 | 129,580,410 |
| Source: U.S. Census Bureau, Population Division, Vintage 2022 Population Estimates, release date: May 2023. | ||
| Table 5. Population Change Between July 1, 2021, and July 1, 2022, by Population Size as of July 1, 2021 | |||
| Population Under 5,000 | |||
| Region | Number of Cities | Average Numeric Change | Average Percent Change |
| (1) Northeast | 1,421 | -6 | -0.4 |
| (2) Midwest | 6,973 | -1 | -0.2 |
| (3) South | 4,953 | 8 | 0.4 |
| (4) West | 1,332 | 7 | 0.5 |
| Population of 5,000 to 9,999 | |||
| Region | Number of Cities | Average Numeric Change | Average Percent Change |
| (1) Northeast | 303 | -25 | -0.4 |
| (2) Midwest | 546 | 17 | 0.2 |
| (3) South | 585 | 96 | 1.4 |
| (4) West | 225 | 51 | 0.7 |
| Population of 10,000 to 49,999 | |||
| Region | Number of Cities | Average Numeric Change | Average Percent Change |
| (1) Northeast | 298 | -54 | -0.3 |
| (2) Midwest | 799 | 3 | 0 |
| (3) South | 796 | 318 | 1.5 |
| (4) West | 464 | 106 | 0.5 |
| Population of 50,000 or More | |||
| Region | Number of Cities | Average Numeric Change | Average Percent Change |
| (1) Northeast | 82 | -2,130 | -0.3 |
| (2) Midwest | 165 | -432 | -0.2 |
| (3) South | 253 | 1,487 | 1.1 |
| (4) West | 298 | 256 | 0.1 |
| Source: U.S. Census Bureau, Population Division, Vintage 2022 Population Estimates, release date: May 2023. |
|||
| Â Table 6. The 10 Most Populous U.S. Metro Areas on July 1, 2022, and Their Numeric Change Between July 1, 2021, and July 1, 2022 | ||||
| Rank | Metro Area | July 1, 2021 | July 1, 2022 | Numeric Change |
| 1 | New York-Newark-Jersey City, NY-NJ-PA | Â 19,774,386 | 19,617,869 | -156,517 |
| 2 | Los Angeles-Long Beach-Anaheim, CA | Â 12,972,847 | 12,872,322 | -100,525 |
| 3 | Chicago-Naperville-Elgin, IL-IN-WI | Â 9,519,538 | 9,441,957 | -77,581 |
| 4 | Dallas-Fort Worth-Arlington, TX | Â 7,773,289 | 7,943,685 | 170,396 |
| 5 | Houston-The Woodlands-Sugar Land, TX | Â 7,215,837 | 7,340,118 | 124,281 |
| 6 | Washington-Arlington-Alexandria, DC-VA-MD-WV | 6,364,907 | 6,373,756 | 8,849 |
| 7 | Philadelphia-Camden-Wilmington, PA-NJ-DE-MD | 6,253,320 | 6,241,164 | -12,156 |
| 8 | Atlanta-Sandy Springs-Alpharetta, GA | Â 6,143,138 | 6,222,106 | 78,968 |
| 9 | Miami-Fort Lauderdale-Pompano Beach, FL | 6,109,373 | 6,139,340 | 29,967 |
| 10 | Phoenix-Mesa-Chandler, AZ | Â 4,942,837 | 5,015,678 | 72,841 |
| Source: U.S. Census Bureau, Population Division, Vintage 2022 Population Estimates, release date: May 2023. |
||||
Technical Notes
The statistics released today cover all local functioning governmental units, including incorporated places (such as cities and towns), minor civil divisions (such as townships), and consolidated cities (government units for which the functions of an incorporated place and its parent county have merged). The Census Bureau develops city and town population estimates by using updated housing unit estimates to distribute county household population to subcounty areas based on the average household population per housing unit. An estimate of the population in group quarters is added to that to obtain the total resident population. The Vintage 2022 methodology statement and release notes are available at <www.census.gov/programs-surveys/popest/technical-documentation/methodology.html>.
Today’s release includes July 1, 2022, population estimates for metropolitan and micropolitan statistical areas, collectively known as core based statistical areas (CBSAs). The July 1, 2022, county population estimates used the new county-equivalent planning regions in Connecticut. However, the current March 2020 Office of Management and Budget (OMB) delineations of CBSAs were instated before the change to the planning regions in Connecticut, and CBSAs in Connecticut are therefore based on the legacy Connecticut counties. This CBSA release does not include components of change, and only includes resident population and numeric population change. OMB also delineates combined statistical areas (CSAs). The procedures and data availability mentioned above for CBSAs also apply to CSAs in this release. More information is available in the Vintage 2022 release notes.
In June, the Census Bureau is scheduled to release estimates of the July 1, 2022, population by age, sex, race and Hispanic origin for the nation, states and counties, and population by age and sex for the Commonwealth of Puerto Rico and Puerto Rico municipios. The data will be embargoed. More information on the timing of specific population and housing unit estimates products is available at <www.census.gov/programs-surveys/popest/about/schedule.html>.
With each new release of annual estimates, the entire time series of estimates is revised for all years back to the date of the last census. All previously published estimates (e.g., old vintages) are superseded and archived on the FTP2 site.

WARRICK HUMANE SOCIETY PRESENTS “LOW-COST VACCINE CLINICâ€

WARRICK HUMANE SOCIETY PRESENTS “LOW-COST VACCINE CLINICâ€
Newburgh, IN – May 30, 2013
Warrick Humane Society is hosting a Low-Cost Vaccination Clinic open to the public on Tuesday, June 6, 2023, from 11 am to 2 pm (or later if pets are still being seen). Registration opens at 10 am, and registration is limited to the first 50 dogs or cats. Registration for the clinic is first come, first serve and will end at 1 pm unless we register 50 pets prior to 1 pm. A registration table will be set up on the patio of the Home Away Pet Spa next to the shelter.
Please expect a potentially long wait and plan your day accordingly. We can only see domesticated dogs and cats. No feral animals. For the safety of your pet, all dogs MUST be on a leash and cats MUST be in a carrier. Cash and credit cards are accepted for payment.
Pricing for services:
Rabies – $17
DA2PP – $17
Bordetella – $15
Heartworm Test – $22
FVRCP – $17
FeLV/FIV test – $25
Microchip – $20
Flea Treatment – $10-$20
Dewormer – $5-$15
For more information contact:
Kim Henning
Warrick Humane Society Assistant Director
812-858-1132
WHSassistantdirector@gmail.com
GET OUTDOORS INDIANA

 |
|||||||||||||||||||||||||||||
Indiana State Park Inn summer lodging savingsStay two nights, and receive 25% off your stay May 29 through Aug. 31, 2023. Valid Sunday through Thursday only. Must stay two consecutive nights. Certain property specific restrictions may apply. Reserve today by calling 1.877.LODGES1 or reserve at IndianaInns.com.
Get your summer passesTo visit state parks regularly or to launch your boat in DNR waters, get your yearly permits now. We have available for purchase online:
Need a summer job?Looking for a summer job that gets you out into nature? We’re hiring seasonal staff for this recreation season at State Parks and Fish & Wildlife areas. Some of the available jobs include labor/property workers, lifeguards, gate attendants, naturalist aides, office help and more. Apply at http://on.IN.gov/dnrjobs. Indiana State Park Inns are also hiring for an assortment of jobs. Find out more at Indianainnsjobs.com.
Explore Indiana and earn prizesIndiana is home to many unique and remarkable natural features. From state parks to forests and lakes, this passport includes more than 80 outdoor locations to explore. It’s free to sign up. All you need to do is check in to one of the passport locations, and you will be on your way to earning prizes. The more you visit, the more you win.
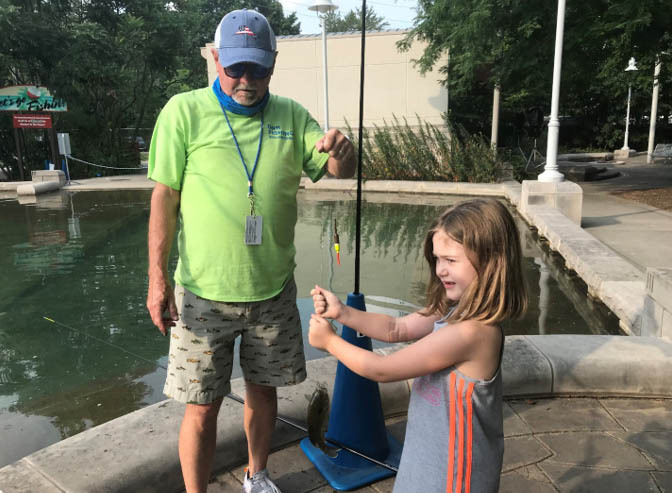
National Fishing and Boating Week and Free Fishing DaysCelebrate National Fishing and Boating Week, June 3-11, with a fishing trip. What better way to celebrate than taking your family, friends, and neighbors out on the water? Indiana residents who fish on June 3-4 don’t need a fishing license or trout/salmon stamp to fish on state waters, as these days are Free Fishing Days. Keep in mind that all other rules such as seasons, bag, and size limits still apply on Free Fishing Days. Explore the outdoors today.
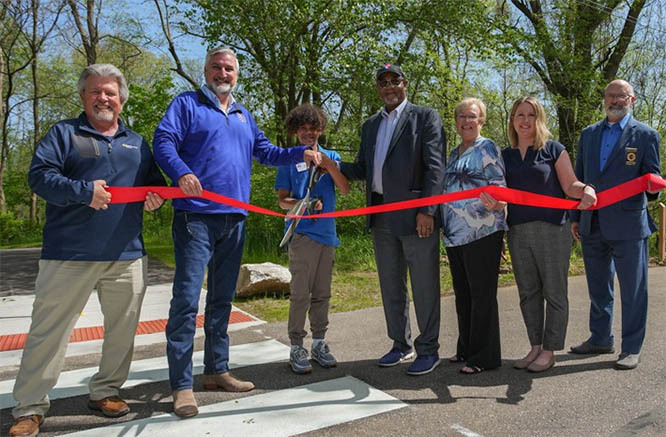
Gov. Holcomb announces fourth round of Next Level Trails at Elkhart trail celebrationGov. Eric J. Holcomb recently announced details for the fourth round of the Next Level Trails (NLT) grant program, which will dedicate an additional $30 million to connect communities through more hiking, biking, and riding trails across the state. To date, NLT has awarded $150 million to 75 projects across the state. The fourth round will award up to $22.5 million to regional projects and up to $7.5 million to local projects.
DNR seeks State Fair Fishin’ Pond volunteersAs you’re planning for the summer, remember to add volunteering at the DNR State Fair Fishin’ Pond to your calendar. DNR is seeking volunteers to help ensure the Fishin’ Pond runs smoothly. With four different volunteer positions available, we have the perfect opportunity for you. Come mentor the next generation of anglers.
2023-24 Migratory bird hunting seasons announcedIndiana’s migratory bird hunting seasons for 2023-24 have been submitted to the U.S. Fish and Wildlife Service. The hunting seasons include those for mourning dove, waterfowl (i.e., ducks, coots, mergansers, and geese), woodcock, snipe, and sora rails.
Grants available for field trips to state parks, lakesEducators interested in taking K-12 students on field trips to an Indiana state park or state-managed lake in the 2023-24 school year can receive financial help through the Indiana Natural Resources Foundation (INRF). Grants from the Discover the Outdoors fund are available for all school types. Since the grant program’s inception in 2013, 174 school grants have been awarded, providing the financial opportunity for more than 18,000 students to visit state parks.
Wearing a life jacket could save your loved ones lifeWearing a life jacket could prevent most loss of life tragedies that happen in the water. A large percentage of drowning victims are over the age of 20. Life jackets are for everyone. DNR encourages everyone to learn to swim, but a life jacket is still the best option to prevent drowning. Let’s all work together for a safe and enjoyable summer and pass the word to Wear It Indiana!
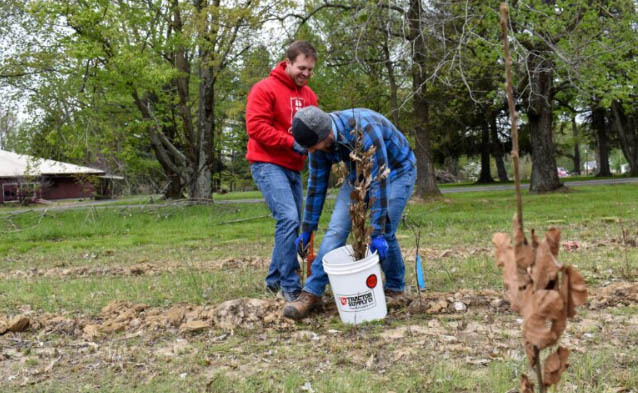
Indiana Tree Project continues growing Indiana’s forestsVolunteers from Clif Bar recently joined the Indiana Natural Resources Foundation and the Division of Forestry to plant 2,500 trees in Greene-Sullivan State Forest. The Indiana Tree Project planting, completed in celebration of Earth Day and Arbor Day, continued a strong relationship between the groups. Clif Bar’s support of the Indiana Tree Project and the INRF began in 2019 and since then has featured five planting days, 20,000 new trees, and many hours of volunteering on Indiana’s public lands.
(From left) Robert Wrenn barn, Monroe County; Anja Martin 1st Pres Church, Goshen; Amanda Bennett-Cole, City Methodist, Gary DNR announces winners of historic photo contestThe DNR Division of Historic Preservation & Archaeology has announced the winners of its annual Historic Preservation Month photo contest.
Full slate of activities now open at McCormick’s Creek State ParkThe activities and buildings that closed on March 31 due to storm damage have reopened.
Attention Father’s Day ShoppersDad wants Outdoor Indiana magazine. Buy him a gift subscription or get one for yourself at shopINstateparks.com. View excerpts of the May-June issue at OutdoorIndiana.org.
|


HOT JOBS

Manager, Clinical Operations Ascension – Remote Schedule: Full time, Monday – Friday, 8 hour shift. This is a full-time/fully remote position. Care Modernization and Experience supports the use of hardware,… May 26
CNA Certified Nursing Assistant-Short Term Option Ascension – Chicago, IL Schedule: Night shift, Full Time (8, 12 or 14 weeks, with a maximum of 36 total weeks). Assist with basic patient care activities.  Easily apply
May 26
Physician Recruiter – 100% Remote Providence – Texas The Physician Recruiter has primary accountability for full-cycle recruitment of physicians and advanced practitioner candidates. May 26
Imaging Services Assistant Ascension – Chicago, IL Schedule: Full Time Mon-Fri 7:30am-4pm. Assist technologists and take radiologic film providing quality images to physicians to aid in the diagnosis of medical… May 26
Data Analyst Ascension – Birmingham, AL Collect and analyze data from multiple sources for the development of reports and statistical information. Compile analytical and statistical reports as needed. May 26
Psychometrist–Developmental Pediatrics Ascension – Austin, TX Provide neuropsychological and psychological testing under the supervision of a licensed psychologist. Document behavioral observations of patients during… May 26
Provider Networks Manager Ascension – Nashville, TN Schedule: Full-Time, 8-hour day shift, Monday – Friday, Fully Remote. As the Provider Networks Manager, you’ll oversee the day-to-day operations and clinical… May 26
Project Manager Ascension – Remote Schedule: 8-hour day shift, Monday – Friday – Partially Remote. Facility: Automated Business Services (ABS). As the project manager, you’ll manage the assigned… May 26
Clinical Informatics Specialist Providence – Texas The Clinical Informatics Specialist (CIS) serves as a professional role model in promoting the understanding, integration, and application of information… May 26
Assistant of Office Operations Ascension – Jacksonville, FL Schedule: Full-Time, Days Mon. Work in a customer service capacity providing administrative and clerical support to patients and customers in a medical setting. May 26