Home Blog Page 1066

MAYORAL CANDIDATE CHERYL MUSGRAVE SHARES HER LIFE EXPERIENCES

0

Last year, after a lot of thought and consultation with my family, I decided to run for Mayor of Evansville.

Evansville deserves better.

Let me share something about my background. I wasn’t born in Evansville–but I got here as soon as I could.

My father was in the U.S. Air Force. That’s why I was born in West Germany. It’s why my first memories are of Naples, Italy. Our family followed my father’s postings around Europe and America for the whole of my childhood.

I’ve been working since I was 14 years old.  From babysitting full-time in the summers during high school to waiting for restaurant tables, catering, McDonald’s, mowing grass, and painting, I did whatever it took to move out of the genteel poverty of my childhood.  At times this included sewing my own clothes and it always meant never eating out. Unless it was at the restaurant I was working for. 

I worked these same jobs during college, where I was a Pell Grant student.  

As an adult, I worked in law firms, including 6 years setting up my husband’s law practice with him.  He had to hire three people to replace me when I was elected County Assessor. 

My private sector experience has always informed my work as an elected official.  I know just how hard it is for families to make ends meet.  The kitchen table is not always loaded with food; it is often covered in bills and spreadsheets and calculations to make ends meet. 

Those experiences taught me about duty and service. And it also taught me what it takes to make a home.

I’ve made my home in Evansville. I raised two children here. Now, two granddaughters live here. And I want Evansville to be the best it can be for them–and for all of us, and for all of our families.

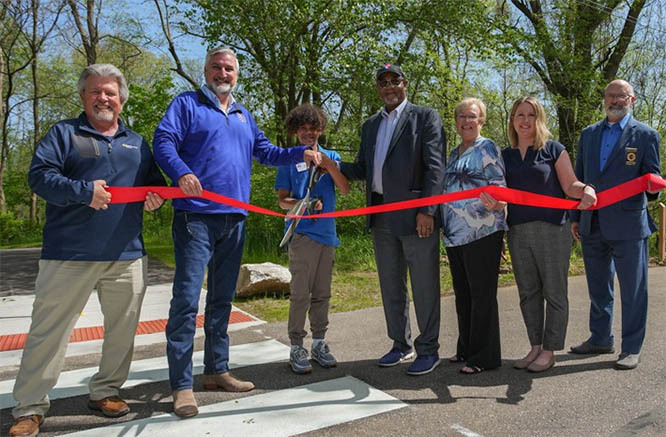
Making Evansville the best it can be will take a mayor who can lead. As County Commissioner, I’ve worked with my colleagues. We brought raises for sheriffs, new cycling and running paths, a better Burdette Park, and universal broadband to the unincorporated county.  I’ve shown that I can lead.

In my career, I’ve learned how experienced public servants can help their communities thrive. Even what seem like small details require your full attention from the beginning.

I know being your mayor will be a challenge. But I also think it’s my duty–for my family and for the city I’ve chosen as my home.

Being mayor is a big job.

The next mayor will need to restore leadership to our police. She will have to clean up the parks and pave the roads. Over four years, she will oversee more than one point six billion dollars in spending. Hundreds of people will work under her direction.

Who do you trust with that responsibility?

As a candidate, it’s my duty to convince you that I’m the best person for the job. As citizens, you have the most important task: choosing the right candidate.

My record shows I can make tough decisions.

My experience shows that I can work as part of a team–and I work across party lines.

I am ready to work for you. From day one. Make the best choice for Evansville.

Cheryl

Another Debt-Ceiling Dance On The Volcano’s Rim

0

Another Debt-Ceiling Dance On The Volcano’s Rim

In the debt ceiling showdown, President Joe Biden and House Speaker Kevin McCarthy, R-California, ended up making the same bet.

Each man wagered not only that the center can hold but that it still exists—that there still is a large enough core of Americans who are willing to work through differences to make this country function to make a deal possible.

That’s no sure thing.

Americans are divided in ways they haven’t been for more than a half-century, since the tumultuous, even tortured 1960s. Egged on by leaders who see both profit and paths to power in encouraging division, huge swaths of the nation have become accustomed to thinking nothing but the worst of their fellow citizens.

This problem is exacerbated by decades of sophisticated gerrymandering in the U.S. House of Representatives, which has left the people’s chamber stuffed with extremists from both parties. Because their experiences have prepared them to deal only with people who already agree with them on everything, these extremists wouldn’t know how to close a deal if the instructions were written in big block letters on the lid.

They’re more interested in making statements than getting things done.

That’s why the rabid right-wingers in the House Republican caucus pushed McCarthy, a relentlessly ambitious pragmatist cloaking himself in the garb of an ideologue, through 15 humiliating votes before installing him as speaker—even though the party had no other plausible alternative.

They made a statement, all right—one that weakened the hand they and their leader held for all the wagers ahead.

This disconnection from reality revealed itself in the eye-to-eye staring contest McCarthy entered with Biden over the debt ceiling and curbing budget deficits.

The most extreme elements in McCarthy’s camp—including former President Donald Trump—blithely dismissed the consequences of having the nation default on its debt.

McCarthy, one suspect, knew better.

He likely realized that the impact of a default, with its accompanying delayed or missed Social Security and other payments, would have hit the GOP’s rural constituency with disproportionate harshness. The ardor of even the MAGA crowd for grand gestures likely would have diminished once people began to miss meals and saw property foreclosures as a realistic possibility.

This understanding undercut McCarthy’s bargaining position from the beginning. It’s hard to pull the trigger on the gun with which you’re threatening someone else when it’s pointed at your own head.

That’s why the deal that emerged carried little in the way of conservative victories that couldn’t have been achieved through more traditional—and decidedly less high-stakes—means.

McCarthy touted the bargain as the first time in history that spending would be cut.

But it won’t be.

The deal calls for domestic spending to flatline for two years and military spending to see slight increases. Whatever supposed budget restraint might be imposed likely will be circumvented by using funds earmarked for other purposes—pandemic spending, etc.—to supplement areas and agendas feeling a pinch.

The major concession McCarthy extracted was symbolic, one demanding a work requirement for certain benefits. In practical terms, this affects few people receiving the benefits in question and merely adds a burden for the government workers administering the program.

But it is a gesture—one that resonates with the MAGA base.

For that reason, McCarthy made it a priority.

Because, again, grand gestures often matter more to his constituency than getting things done.

The greatest overall effect of this debt ceiling/budget bargain is that Biden and the Democrats won’t be able to engage in any ambitious social service spending programs for the next two years.

But, so long as Republicans control the House, such sweeping progressive ambitions never were a possibility anyway. Whatever progressives’ dreams might have been or might be, they didn’t have the votes.

And votes are the currency that counts in legislative bodies.

So, we Americans watched our leaders dance the nation along the volcano’s edge for no good reason.

The deal that emerged was like most political deals—imperfect and likely to satisfy almost no one but enough to keep the nation Abraham Lincoln once called “the last best hope of earth” stumbling forward for a little while longer.

Yes, despite our leaders’ best efforts to send us tumbling over the edge, we Americans found a way to stumble forward once again.

That’s politics.

FOOTNOTE: John Krull is director of Franklin College’s Pulliam School of Journalism and publisher of TheStatehouseFile.com, a news website powered by Franklin College journalism students. The views expressed are those of the author only and should not be attributed to Franklin College.

Large Southern Cities Lead Nation in Population Growth

0

Large Southern Cities Lead Nation in Population Growth

Texas Continues to Top the Charts With Fastest-Growing Cities

MAY 30, 2023 — Nine of the nation’s 15 fastest-growing cities were in the South, according to Vintage 2022 Population Estimates released today by the U.S. Census Bureau. Of the nine fastest-growing cities in the South, six were in Texas. New estimates for metropolitan and micropolitan statistical areas and for housing units at the national, state and county levels were also released today.

Heading South: 15 Fastest Growing Large Cities in the United States: July 1, 2021 to July 1, 2022

“Georgetown, Texas, remained the fastest-growing city by percent change in 2022, with the highest rate of growth among all U.S. cities and towns with at least 50,000 people. It wasn’t the only city to retain its distinction over the year, however,” said Crystal Delbé, a statistician in the Census Bureau’s Population Division. “New York remained the nation’s largest city, despite its recent population decline. At 8.3 million, its population was more than twice that of the next largest city, Los Angeles, with a population of nearly 4 million.”

Following the population increase of 14.4% in Georgetown, Texas, was Santa Cruz, California, with a 12.5% increase, adding roughly 7,000 people to its population. The next three fastest-growing cities were also in Texas — Kyle, Leander, and Little Elm.

Texas was the only state that had more than three cities on both the 15 fastest-growing large cities and towns by numeric change and by percent change lists. Fort Worth, Texas, had the largest numeric population gain in 2022, with an increase of 19,170 people. Phoenix, Arizona (19,053); San Antonio, Texas (18,889); Seattle, Washington (17,749); and Charlotte, North Carolina (15,217), rounded out the top five cities by numeric growth.

Most Populous Cities

Charlotte, North Carolina, returned to the list of the top 15 largest cities in 2022, ranking 15th after dropping to 16th in 2021.

Following New York and Los Angeles in population size were

  • Chicago, Illinois (2.7 million).
  • Houston, Texas (2.3 million).
  • Phoenix, Arizona (1.6 million).
  • Philadelphia, Pennsylvania (1.6 million).
  • San Antonio, Texas (1.5 million).
  • San Diego, California (1.4 million).
  • Dallas, Texas (1.3 million).
  • Austin, Texas (1.0 million).
  • Jacksonville, Florida (1.0 million).
  • San Jose, California (1.0 million).
  • Fort Worth, Texas (1.0 million).
  • Columbus, Ohio (907,971).

Population Change in Small Towns and Regional Differences

While nearly 40% (129.6 million) of the nation’s population lived in the 4.1% (798) of cities with populations of 50,000 or more, the United States remained a nation of small towns. Of approximately 19,500 incorporated places, about 75% had fewer than 5,000 people and nearly 33% had fewer than 500.

On average, these small towns experienced uneven growth across U.S. regions:

  • Northeast small towns declined by 0.4%.
  • Midwest small towns declined by 0.2%.
  • Small towns in the South grew by 0.4%.
  • Western small towns saw the largest growth from 2021 to 2022, with an increase of 0.5%.

Other Highlights

Crossing population milestones:

  • Three cities joined the list of cities with populations of 50,000 or more in 2022 — Wake Forest, North Carolina (51,113); Rockwall, Texas (51,461); and Eagle Mountain, Utah (54,149).
  • Two cities in Texas crossed the 100,000 population mark in 2022 — Conroe (101,405) and New Braunfels (104,707).

Metropolitan and Micropolitan Statistical Areas

Metropolitan statistical areas:

  • U.S. metro areas grew by approximately 0.4% between 2021 and 2022.
  • Roughly two-thirds (65.1%) of the 384 U.S. metro areas saw increases in population between 2021 and 2022.
  • The New York-Newark-Jersey City, NY-NJ-PA metro area was the most populous  with a population of 19,617,869 as of July 1, 2022, a decrease of 156,517 from July 1, 2021, with the Los Angeles-Long Beach-Anaheim, CA metro area being the second-most populous with a 2022 population of 12,872,322, a decrease of 100,525 from 2021.
  • Ten U.S. metro areas had populations of at least 5 million in 2022, with six of the ten increasing in population between 2021 and 2022.
  • The Phoenix-Mesa-Chandler, AZ metro area surpassed the 5 million population threshold between 2021 and 2022.
  • The Dallas-Fort Worth-Arlington, TX metro area had the highest numeric increase in population between 2021 and 2022 of any U.S. metro area, with an annual jump of 170,396 people, followed by the Houston-The Woodlands-Sugar Land, TX metro area which added 124,281 residents over the same time period.
  • The Villages, FL metro area was the fastest-growing U.S. metro area between 2021 and 2022, increasing by 7.5%.

Micropolitan statistical areas:

  • U.S. micro areas grew by approximately 0.1% between 2021 and 2022.
  • Approximately 45% of the 543 U.S. micro areas saw increases in population between 2021 and 2022.
  • The Pullman, WA micro area had the largest numeric and percent increase of all U.S. micro areas between 2021 and 2022, adding 4,381 people (10.1%).
  • The Susanville, CA micro area had the largest numeric and percent decrease of all U.S. micro areas between 2021 and 2022, declining by 1,909 people (-6.0%).

Modest Housing Unit Growth in Nearly All States

The nation’s housing stock grew by about 1.6 million units between July 2021 and July 2022, reaching a total of 143.8 million with an annual growth rate of 1.2%. This represents a slight increase from the 1.0% in 2020-2021.

  • California had the largest number of housing units (14.6 million), followed by Texas (12.1 million) and Florida (10.3 million), while Wyoming (277,116) and Alaska (329,285) had the fewest housing units.
  • Utah experienced the nation’s fastest growth in housing units, with an increase of 3.3% between July 1, 2021, and July 1, 2022, followed by Idaho (2.8%) and Texas (2.3%). Rhode Island (0.2%), New Jersey (0.2%), Illinois (0.2%) and Connecticut (0.3%) had the slowest rates of housing growth.
  • Harris County, Texas (32,694); Maricopa County, Arizona (28,051); Travis County, Texas (27,927); Philadelphia County, Pennsylvania (24,701); and Los Angeles County, California (21,738), were the five counties with the largest numeric gains in housing units between July 1, 2021, and July 1, 2022.
  • Wasatch County, Utah, was the fastest-growing county; its housing stock increased by 7.7% between July 1, 2021, and July 1, 2022, followed by Rockwall County, Texas (7.4%), and St. Johns County, Florida (6.6%). Jasper County, South Carolina, and Teton County, Idaho were tied for fourth with 6.4%.
  • Bristol City, Virginia, Martinsville City, Virginia, and Grant County, Nebraska, had the largest percent decreases in housing units between 2021 and 2022 with -0.3%.

The complete list of counties is available in the data visualization, A Snapshot of the Nation’s Housing Stock

Table 1. The 15 Fastest-Growing Large Cities Between July 1, 2021, and July 1, 2022, With Populations of 50,000 of More on July 1, 2021
Rank Area Name State Percent Increase 2022 Total Population
1 Georgetown city Texas 14.4 86,507
2 Santa Cruz city California 12.5 61,800
3 Kyle city Texas 10.9 57,470
4 Leander city Texas 10.9 74,375
5 Little Elm city Texas 8.0 55,357
6 Westfield city Indiana 7.7 54,605
7 Queen Creek town Arizona 6.7 70,734
8 North Port city Florida 6.6 85,099
9 Cape Coral city Florida 6.4 216,992
10 Port St. Lucie city Florida 6.4 231,790
11 Conroe city Texas 6.3 101,405
12 Maricopa city Arizona 6.2 66,290
13 New Braunfels city Texas 5.7 104,707
14 Lehi city Utah 5.6 84,373
15 Medford city Massachusetts 5.2 65,399
Source: U.S. Census Bureau, Population Division, Vintage 2022 Population Estimates, release date: May 2023.


Table 2. The 15 Cities With the Largest Numeric Increases Between July 1, 2021, and July 1, 2022, With Populations of 50,000 of More on July 1, 2021
Rank Area Name State Numeric Increase 2022 Total Population
1 Fort Worth city Texas 19,170 956,709
2 Phoenix city Arizona 19,053 1,644,409
3 San Antonio city Texas 18,889 1,472,909
4 Seattle city Washington 17,749 749,256
5 Charlotte city North Carolina 15,217 897,720
6 Jacksonville city Florida 14,408 971,319
7 Port St. Lucie city Florida               13,887 231,790
8 Cape Coral city Florida 13,017 216,992
9 Houston city Texas 11,223 2,302,878
10 Georgetown city Texas 10,887 86,507
11 North Las Vegas city Nevada 9,419 280,543
12 Henderson city Nevada 8,994 331,415
13 Dallas city Texas 8,833 1,299,544
14 Irvine city California 8,589 313,685
15 Frisco city Texas 8,506 219,587
Source: U.S. Census Bureau, Population Division, Vintage 2022 Population Estimates, release date: May 2023.


Table 3. The 15 Most Populous Cities on July 1, 2022
Rank Area Name State 2022 Total Population
1 New York city New York 8,335,897
2 Los Angeles city California 3,822,238
3 Chicago city Illinois 2,665,039
4 Houston city Texas 2,302,878
5 Phoenix city Arizona 1,644,409
6 Philadelphia city Pennsylvania 1,567,258
7 San Antonio city Texas 1,472,909
8 San Diego city California 1,381,162
9 Dallas city Texas 1,299,544
10 Austin city Texas 974,447
11 Jacksonville city Florida 971,319
12 San Jose city California 971,233
13 Fort Worth city Texas 956,709
14 Columbus city Ohio 907,971
15 Charlotte city North Carolina 897,720
Source: U.S. Census Bureau, Population Division, Vintage 2022 Population Estimates, release date: May 2023.


Table 4. Total Population Living in Cities and Towns by Population Size as of July 1, 2022
Population Size Number of Cities and Towns Total Population
Under 5,000 14,667 16,293,055
5,000 to 9,999 1,659 11,816,669
10,000 to 49,999 2,369 52,034,801
50,000 and Over 798 129,580,410
Source: U.S. Census Bureau, Population Division, Vintage 2022 Population Estimates, release date: May 2023.


Table 5. Population Change Between July 1, 2021, and July 1, 2022, by Population Size as of July 1, 2021
Population Under 5,000
Region Number of Cities Average Numeric Change Average Percent Change
(1) Northeast 1,421 -6 -0.4
(2) Midwest 6,973 -1 -0.2
(3) South 4,953 8 0.4
(4) West 1,332 7 0.5
Population of 5,000 to 9,999
Region Number of Cities Average Numeric Change Average Percent Change
(1) Northeast 303 -25 -0.4
(2) Midwest 546 17 0.2
(3) South 585 96 1.4
(4) West 225 51 0.7
Population of 10,000 to 49,999
Region Number of Cities Average Numeric Change Average Percent Change
(1) Northeast 298 -54 -0.3
(2) Midwest 799 3 0
(3) South 796 318 1.5
(4) West 464 106 0.5
Population of 50,000 or More
Region Number of Cities Average Numeric Change Average Percent Change
(1) Northeast 82 -2,130 -0.3
(2) Midwest 165 -432 -0.2
(3) South 253 1,487 1.1
(4) West 298 256 0.1
Source: U.S. Census Bureau, Population Division, Vintage 2022 Population Estimates,
release date: May 2023.


 Table 6. The 10 Most Populous U.S. Metro Areas on July 1, 2022, and Their Numeric Change Between July 1, 2021, and July 1, 2022
Rank Metro Area July 1, 2021 July 1, 2022 Numeric Change
1 New York-Newark-Jersey City, NY-NJ-PA  19,774,386 19,617,869 -156,517
2 Los Angeles-Long Beach-Anaheim, CA  12,972,847 12,872,322 -100,525
3 Chicago-Naperville-Elgin, IL-IN-WI  9,519,538 9,441,957 -77,581
4 Dallas-Fort Worth-Arlington, TX  7,773,289 7,943,685 170,396
5 Houston-The Woodlands-Sugar Land, TX  7,215,837 7,340,118 124,281
6 Washington-Arlington-Alexandria, DC-VA-MD-WV 6,364,907 6,373,756 8,849
7 Philadelphia-Camden-Wilmington, PA-NJ-DE-MD 6,253,320 6,241,164 -12,156
8 Atlanta-Sandy Springs-Alpharetta, GA  6,143,138 6,222,106 78,968
9 Miami-Fort Lauderdale-Pompano Beach, FL 6,109,373 6,139,340 29,967
10 Phoenix-Mesa-Chandler, AZ  4,942,837 5,015,678 72,841
Source: U.S. Census Bureau, Population Division, Vintage 2022 Population Estimates,
release date: May 2023.


Technical Notes

The statistics released today cover all local functioning governmental units, including incorporated places (such as cities and towns), minor civil divisions (such as townships), and consolidated cities (government units for which the functions of an incorporated place and its parent county have merged). The Census Bureau develops city and town population estimates by using updated housing unit estimates to distribute county household population to subcounty areas based on the average household population per housing unit. An estimate of the population in group quarters is added to that to obtain the total resident population. The Vintage 2022 methodology statement and release notes are available at <www.census.gov/programs-surveys/popest/technical-documentation/methodology.html>.

Today’s release includes July 1, 2022, population estimates for metropolitan and micropolitan statistical areas, collectively known as core based statistical areas (CBSAs). The July 1, 2022, county population estimates used the new county-equivalent planning regions in Connecticut. However, the current March 2020 Office of Management and Budget (OMB) delineations of CBSAs were instated before the change to the planning regions in Connecticut, and CBSAs in Connecticut are therefore based on the legacy Connecticut counties. This CBSA release does not include components of change, and only includes resident population and numeric population change. OMB also delineates combined statistical areas (CSAs). The procedures and data availability mentioned above for CBSAs also apply to CSAs in this release. More information is available in the Vintage 2022 release notes.

In June, the Census Bureau is scheduled to release estimates of the July 1, 2022, population by age, sex, race and Hispanic origin for the nation, states and counties, and population by age and sex for the Commonwealth of Puerto Rico and Puerto Rico municipios. The data will be embargoed. More information on the timing of specific population and housing unit estimates products is available at <www.census.gov/programs-surveys/popest/about/schedule.html>.

With each new release of annual estimates, the entire time series of estimates is revised for all years back to the date of the last census. All previously published estimates (e.g., old vintages) are superseded and archived on the FTP2 site.

Program sends Indiana authors around the state to inspire and teach

0

THE INDIANA AUTHORS AWARDS PROGRAM IS BRINGING WRITERS TO MORE THAN 50 ORGANIZATIONS ACROSS THE STATE

  •  
The Indiana Authors Awards program is bringing writers to more than 50 organizations across the state this year.

The program gives awards to Indiana authors of new books. The winners across nine categories get the opportunity to speak, connect, inspire and teach at schools, libraries and nonprofits across Indiana.

“People can hear from authors, see authors, and then for themselves think, ‘Hey! I could do that too,’” said Bronwen Carlisle, the special projects manager for Indiana Humanities, which organizes the Indiana Authors Awards.

And that’s exactly what happens, said Indianapolis author John Anderson. Anderson is a 2022 shortlist winner and has participated in the speaker events for the past five years, visiting approximately 20 schools.

“There are always kids that come up and talk to you at the end, and basically their message is the same: I want to be an author, I want to grow up and write books, I want to share my story with the world,” said Anderson. “It’s knowing that you are there in that space and you sort of make that visible to them, that it is possible.”

Helen Frost, an award winner for this year and the author of 11 novels and seven children’s books emphasized the importance of these events for new writers.

“There are a lot of yet-to-be-published writers in Indiana, so doing these programs is a chance for the published writers to be connected with writers still early on in their career,” she said. “So, it’s a way to make all kinds of connections to adults, to published, to not published, to poetry and prose. I just think it’s really just an expansive program in many ways.”

Organizations can apply to have an author come and speak or lead a workshop. Grants pay for all of the primary costs to the host sites, although groups can choose to spend extra money on books, etc. Anderson said this creates the opportunity for children to hear from authors they otherwise would not have access to.

Funded by Glick Philanthropies, these events are free and, except for some schools (check with the organization), open to the public. To find more information on dates and locations use this link:https://www.indianaauthorsawards.org/all-events/

FOOTNOTE: Arianna Hunt is a reporter for TheStatehouseFile.com, a news website powered by Franklin College journalism students.

WARRICK HUMANE SOCIETY PRESENTS “LOW-COST VACCINE CLINIC”

0

WARRICK HUMANE SOCIETY PRESENTS “LOW-COST VACCINE CLINIC”

Newburgh, IN – May 30, 2013

Warrick Humane Society is hosting a Low-Cost Vaccination Clinic open to the public on Tuesday, June 6, 2023, from 11 am to 2 pm (or later if pets are still being seen). Registration opens at 10 am, and registration is limited to the first 50 dogs or cats. Registration for the clinic is first come, first serve and will end at 1 pm unless we register 50 pets prior to 1 pm. A registration table will be set up on the patio of the Home Away Pet Spa next to the shelter.

Please expect a potentially long wait and plan your day accordingly. We can only see domesticated dogs and cats. No feral animals. For the safety of your pet, all dogs MUST be on a leash and cats MUST be in a carrier. Cash and credit cards are accepted for payment.

Pricing for services:

Rabies – $17
DA2PP – $17
Bordetella – $15
Heartworm Test – $22
FVRCP – $17
FeLV/FIV test – $25
Microchip – $20
Flea Treatment – $10-$20
Dewormer – $5-$15

For more information contact:

Kim Henning
Warrick Humane Society Assistant Director
812-858-1132
WHSassistantdirector@gmail.com


GET OUTDOORS INDIANA

0
June 2023

Indiana State Park Inn summer lodging savings

Stay two nights, and receive 25% off your stay May 29 through Aug. 31, 2023. Valid Sunday through Thursday only. Must stay two consecutive nights. Certain property specific restrictions may apply.

Reserve today by calling 1.877.LODGES1 or reserve at IndianaInns.com.


Indiana Dunes

Get your summer passes

To visit state parks regularly or to launch your boat in DNR waters, get your yearly permits now.

We have available for purchase online:

  • Annual state park entrance permit
  • Golden Hoosier entrance permit
  • Motorized lake permit
  • Non-motorized lake permit
  • Annual horse tag
  • Off-road cycling permit
Buy now

work

Need a summer job?

Looking for a summer job that gets you out into nature? We’re hiring seasonal staff for this recreation season at State Parks and Fish & Wildlife areas. Some of the available jobs include labor/property workers, lifeguards, gate attendants, naturalist aides, office help and more. Apply at http://on.IN.gov/dnrjobs.

Indiana State Park Inns are also hiring for an assortment of jobs. Find out more at Indianainnsjobs.com.


nature passport

Explore Indiana and earn prizes

Indiana is home to many unique and remarkable natural features. From state parks to forests and lakes, this passport includes more than 80 outdoor locations to explore. It’s free to sign up. All you need to do is check in to one of the passport locations, and you will be on your way to earning prizes. The more you visit, the more you win.

More

boating

National Fishing and Boating Week and Free Fishing Days

Celebrate National Fishing and Boating Week, June 3-11, with a fishing trip. What better way to celebrate than taking your family, friends, and neighbors out on the water? Indiana residents who fish on June 3-4 don’t need a fishing license or trout/salmon stamp to fish on state waters, as these days are Free Fishing Days.

Keep in mind that all other rules such as seasons, bag, and size limits still apply on Free Fishing Days. Explore the outdoors today.

More

NLT

Gov. Holcomb announces fourth round of Next Level Trails at Elkhart trail celebration

Gov. Eric J. Holcomb recently announced details for the fourth round of the Next Level Trails (NLT) grant program, which will dedicate an additional $30 million to connect communities through more hiking, biking, and riding trails across the state.

To date, NLT has awarded $150 million to 75 projects across the state.

The fourth round will award up to $22.5 million to regional projects and up to $7.5 million to local projects.

More

fishin pond

DNR seeks State Fair Fishin’ Pond volunteers

As you’re planning for the summer, remember to add volunteering at the DNR State Fair Fishin’ Pond to your calendar. DNR is seeking volunteers to help ensure the Fishin’ Pond runs smoothly. With four different volunteer positions available, we have the perfect opportunity for you. Come mentor the next generation of anglers.

More

geese

2023-24 Migratory bird hunting seasons announced

Indiana’s migratory bird hunting seasons for 2023-24 have been submitted to the U.S. Fish and Wildlife Service. The hunting seasons include those for mourning dove, waterfowl (i.e., ducks, coots, mergansers, and geese), woodcock, snipe, and sora rails.

More

Grants available for field trips to state parks, lakes

Educators interested in taking K-12 students on field trips to an Indiana state park or state-managed lake in the 2023-24 school year can receive financial help through the Indiana Natural Resources Foundation (INRF).

Grants from the Discover the Outdoors fund are available for all school types.

Since the grant program’s inception in 2013, 174 school grants have been awarded, providing the financial opportunity for more than 18,000 students to visit state parks.

More

life jacket

Wearing a life jacket could save your loved ones life

Wearing a life jacket could prevent most loss of life tragedies that happen in the water.

A large percentage of drowning victims are over the age of 20. Life jackets are for everyone.

DNR encourages everyone to learn to swim, but a life jacket is still the best option to prevent drowning.

Let’s all work together for a safe and enjoyable summer and pass the word to Wear It Indiana!

More

tree planting

Indiana Tree Project continues growing Indiana’s forests

Volunteers from Clif Bar recently joined the Indiana Natural Resources Foundation and the Division of Forestry to plant 2,500 trees in Greene-Sullivan State Forest. The Indiana Tree Project planting, completed in celebration of Earth Day and Arbor Day, continued a strong relationship between the groups.

Clif Bar’s support of the Indiana Tree Project and the INRF began in 2019 and since then has featured five planting days, 20,000 new trees, and many hours of volunteering on Indiana’s public lands.

More

winners

(From left) Robert Wrenn barn, Monroe County; Anja Martin 1st Pres Church, Goshen; Amanda Bennett-Cole, City Methodist, Gary

DNR announces winners of historic photo contest

The DNR Division of Historic Preservation & Archaeology has announced the winners of its annual Historic Preservation Month photo contest.

More

Full slate of activities now open at McCormick’s Creek State Park

The activities and buildings that closed on March 31 due to storm damage have reopened.

  • Canyon Inn – open for lodging, dining, and group use. More info
  • Cabins – Family cabins, Camp McCormick, and Camp NaWaKwa are open and available for rental. More info
  • Nature Center – open with interpretive programming.
  • Saddle Barn – open and ready to welcome riders. More info
  • Shelters – Shelters and recreation buildings are open for picnicking, reunions, etc., except for Beech Grove Shelter and Friendly Recreation Building. More info
  • Activities – Guests can climb the fire tower, see the falls, and visit the Peden Farmstead and the spring house on open trails.
  • Wildflowers – are still popping, and it’s a great time to enjoy birds along open trails, at the Nature Center feeders, and from Canyon Inn’s dining room.
  • Accessibility Chairs – There are two at the Nature Center. One is motorized and can be used on paved surfaces and level, hard-packed soil. The second is hand-powered.
  • Swimming – The public pool opens Memorial Day weekend.

Attention Father’s Day Shoppers

Dad wants Outdoor Indiana magazine. Buy him a gift subscription or get one for yourself at shopINstateparks.com. View excerpts of the May-June issue at OutdoorIndiana.org.


events

INRF

The Foundation celebrates and preserves Indiana’s natural legacy by raising funds to support the Indiana Department of Natural Resources and its programs.

HOT JOBS

0
Manager, Clinical Operations
Ascension – Remote
Schedule: Full time, Monday – Friday, 8 hour shift. This is a full-time/fully remote position. Care Modernization and Experience supports the use of hardware,…
May 26
CNA Certified Nursing Assistant-Short Term Option
Ascension – Chicago, IL
Schedule: Night shift, Full Time (8, 12 or 14 weeks, with a maximum of 36 total weeks). Assist with basic patient care activities.
 Easily apply
May 26
Physician Recruiter – 100% Remote
Providence – Texas
The Physician Recruiter has primary accountability for full-cycle recruitment of physicians and advanced practitioner candidates.
May 26
Imaging Services Assistant
Ascension – Chicago, IL
Schedule: Full Time Mon-Fri 7:30am-4pm. Assist technologists and take radiologic film providing quality images to physicians to aid in the diagnosis of medical…
May 26
Data Analyst
Ascension – Birmingham, AL
Collect and analyze data from multiple sources for the development of reports and statistical information. Compile analytical and statistical reports as needed.
May 26
Psychometrist–Developmental Pediatrics
Ascension – Austin, TX
Provide neuropsychological and psychological testing under the supervision of a licensed psychologist. Document behavioral observations of patients during…
May 26
Provider Networks Manager
Ascension – Nashville, TN
Schedule: Full-Time, 8-hour day shift, Monday – Friday, Fully Remote. As the Provider Networks Manager, you’ll oversee the day-to-day operations and clinical…
May 26
Project Manager
Ascension – Remote
Schedule: 8-hour day shift, Monday – Friday – Partially Remote. Facility: Automated Business Services (ABS). As the project manager, you’ll manage the assigned…
May 26
Clinical Informatics Specialist
Providence – Texas
The Clinical Informatics Specialist (CIS) serves as a professional role model in promoting the understanding, integration, and application of information…
May 26
Assistant of Office Operations
Ascension – Jacksonville, FL
Schedule: Full-Time, Days Mon. Work in a customer service capacity providing administrative and clerical support to patients and customers in a medical setting.
May 26

Gui Tesch Signs With UE Men’s Basketball

0

Gui Tesch Signs With UE Men’s Basketball

Tesch will be a freshman in 2023-24

MAY 30, 2923

EVANSVILLE, Ind. – With summer workouts on the horizon, University of Evansville Head Men’s Basketball Coach David Ragland has announced the signing of Gui Tesch.  The 6-foot-9 forward will be a freshman for the Purple Aces in 2023-24.

“We would love to welcome our final piece of the 2023-24 roster, Gul Tesch.  Gui is a very talented player that’s even a better person,” Ragland explained.  “He has proven to succeed here in the states over the past 4 years both academically and athletically.  Gui will add to our roster more height, skill and shooting which were all necessary characteristics our staff sought after during the spring recruiting cycle.”

Tesch spent his senior season playing at the IMG Academy following his time at North Broward Prep.  Over the course of his high school career, Tesch averaged 14.5 points and 5.5 rebounds per game.  His junior season at North Broward saw him finish with an average of 16 points and 5 boards.

“Gui shoots the ball from beyond the arch well with range.  He can also handle the ball and make decisions that best suit the team.  Gui has competed and been successful with and against some of the best players in the world,” Ragland added.  “He not only has an extremely high-level skillset but also a work ethic that matches.  Our staff looks forward to working with Gui to expand his game and our fans will love watching him evolve over the next 4 years.”

The native of Brazil represented his country in the 2022 FIBA Americas Championship in Mexico.  He led his team with a 23-point, 11-rebound performance against the Dominican Republic while recording 8 points and 5 rebounds over the course of the tournament.  Tesch is set to represent Brazil once again in June when he will take part in the FIBA U19 World Cup.  Running from June 24 through July 2, the tournament will be held in Debrecen, Hungary.

He also participated in the U18 South American Championship where he recorded an average of 10.6 points and 4.2 caroms per game.

MAY’S BIRTHDAYS

0

Jeanne Lou Brown

Dale G Lannert

Anne Scleper

Wade Cartwright

Jane Lawton

John Franks

Deanne Naas

Jon Fuchs

Charles Hendy Ferber

Billie Goodman

Aaron Biggerstaff

Sam Darke

Kerry Gorman Wesner

Zach Etienne

Dennis Au

Ashley Turner

Jason Greer

Lee J Wolfe

Tim Mills

Rick Herdes

Samantha Vaal

Julie Beckwith Merkel

Mike Hahn

Cary Maurer

Shannon Weightman

Dan Whitehead

Chaim Julian

Tom Wedding

Eddie R Robinson

Rob Dyson

Cindy M. Basinski

Sharon Harrison

Alison Jones

Katie Keown Carley

Oscar Velez

Shawn Stevens

Janice Geurin Labhart-Miller

Barbara Huebschman

Jeremy Lee

Jay Timber

Stephen Annis

John Stanley

Chris Siesky

Brent Jochim

Barbara Givens

Craig Egli

Greg Woods

Helen Ball

Susie Webb

Michelle Kirk

Garey W. Patmore

Jenny E Smith

Codi Alan Meyer

Roy Foertsch

Brad Anderson

Katherine Pruitt

Kalah Georgette-Vowels

Kelly Evans Wollenmann

Libby Treado Seltzer

Chad Brady

Tim Black

Jennifer Schoenbaechler

Thomas Schurger

Dannie McIntire

Emily Cosby

Scott Danks

Lisa Roth

John E. Miller

Jon Elpers

Jeremy W. Schnepper

Tracy E. Hayden

Chuck Renner

Garry Fredick

Jon Fuchs

Charlie Henry Farber

Billie Goodman

Aaron Biggerstaff

Ted Ziemer

Lisa Marie Hale

Matthew Field

Elaine Bradley McCarthy

Sandy Goodall Cannon

Ryan Van Laningham

Martin Fraering

Patrick Fairchild

Kim Booker

Jeanne Lou Brown

Dale G Lannert

Anne Schleper

Wade Cartwright

Jane Lawton

John Franks

Deanne Naas

Lee Riddle

Patrick Martin

Norman Patmore

Marc Sedwick

Jake Martin

Sharon Dorris

Jacob Pendleton

Billy Bolin

Alex Hazel

Sherman Greer

James Kelly

Carl Rodenberg

Joanne Muth

Bradley Smith

Karen Goodwin

Robert Ferguson

Matthew Weiss

Pam Cooke Merritt

Alisann Shetler Elpers

Jack Davis

Jack Davis

Richard Lashley

Nancy Fleig

Connie Barron

Jimmy DeTalente

Pete Hillenbrand Jr

David Dk Wells

Rodney Hunt

Rebecca Becki Fulkerson

Gina Moore

Steve Seitz

Kate Mercer Miller

Chris Paddock

Nancy Ritter

Chris Harp

Freda Lewis

Wally Paynter

Tonya Rine

Scott E. Klueh

Donna Salmon

Billy Weir

Ange Humphrey

Wayne Ellis

Linda Luecke

Patti Cosby

Jane Engbers Doughty Holmes

Romona Smith

Steve Bryant

Judy Mossberger

Camilla Buese

Shannon Libbert Miller

Debi Duvall Ziemer

Brian Ferguson

Ed Goebel

Jayne Stuckey Beitler

Tracy Hobgood McGuire

Sherri Eslinger

Teresa Huff

Eadye Simpson

Michael Schmahlenberger

Lorilyn Prestidge

Chad Penrod

Brad Dishman

Regina Cole Kasey

David C. Hart

Kathy Boyd

Corey Fuquay

Gail Pennington

Jeff Smith

Bill Shears

Greg Hobgood

Jon Woebkenberg

Amber Snodgrass Waddell

Gary Virgin

Lynn Lowe

EPD DAILY ACTIVITY REPORT

0
EPD


EPD DAILY ACTIVITY REPORT

20230530024108101

FOOTNOTE:  EPD DAILY ACTIVITY REPORT information was provided by the EPD and posted by the City-County-County Observer without opinion, bias, or editing.